Download
1 / 45
450 likes | 571 Views
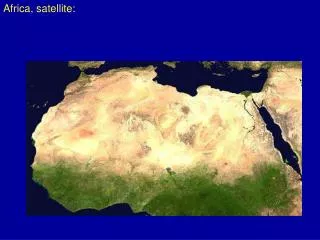
Vegetation Change in North Africa through the analysis of satellite data, 1982 - 2006. Professor Stephen Young Department of Geography, Salem State College. IGC - 2008, Tunis, Tunisia – August 13, 2008. Vegetation Change in North Africa OUTLINE. Why this research?

E N D
Vegetation Change in North Africa through the analysis of satellite data, 1982 - 2006 Professor Stephen Young Department of Geography, Salem State College IGC - 2008, Tunis, Tunisia – August 13, 2008
Vegetation Change in North AfricaOUTLINE • Why this research? • Overview of Data Set & Methodology used. • Overview of where land cover change is occurring. • Overview of persistent vegetation change. • Overview of the Driving Forces behind the changes.
Vegetation Change in North Africa • Why this research?
Why this research? • Have already mapped vegetation change at the global scale and now focusing on the regional scale. • Have researched Australia, East Asia, South Asia, and Southwest Asia – now looking at North Africa. • Looking for strong temporal signals of PERSISTENT vegetation change. • Trying to understand those signals in context with global environmental change.
Why this research? • In particular • Colleagues at this conference may be able to help me understand the vegetation changes which are occurring in North Africa.
Data Used • GIMMS AVHRR land cover data • NOAA / NASA AVHRR data – 8 km resolution • Coarse resolution picks up broad change • Normalized Difference Vegetation Index (NDVI) • (NIR - red) / (NIR + red) • High correlation with photosynthesis
Data Pre-Processing • GIMMS AVHRR data • Base data: NDVI 15-day MVC • Re-composited: Monthly Max Composites, • January 1982 – December 2003 • Re-composited: Annual Average Composites • Re-composited endpoints • (1982 + 1983) ÷ 2 = 1982/83 • (2002 + 2003) ÷ 2 = 2002/03
Data Used • SPOT VEGETATION data (1km) • SPOT IMAGE – 1 km resolution • Finer resolution than GIMMS • Normalized Difference Vegetation Index (NDVI) • (NIR - red) / (NIR + red) • High correlation with photosynthesis
Data Pre-Processing • SPOT VEGETATION data • Base data: NDVI 10-day MVC • Re-composited: Monthly Max Composites, • April 1998 – Dec 2006 • Re-composited: Annual Average Composites • 1998 used Jan, Feb, March of 1999 • Re-composited endpoints • (1998 + 1999) ÷ 2 = 1998/99 • (2005 + 2006) ÷ 2 = 2005/06
Methodology • Pairwise Comparison (Univariate Differencing) • GIMMS: 2002/03 minus 1982/83 = change • SPOT: 2005/06 minus 1998/99 = change • Percent Change • (2002/03 minus 1982/83) / 1982/83 = Percent Change • (2005/06 minus 1998/99) / 1998/99 = Percent Change • Profiling • Graphing change through the period
Table – All Africa Change Classification (% Change) # of Pixels % of Land Pixels Major Decrease (decrease > 20%) 3895 0.1% Decrease (decrease 10 to 20%) 22426 3.8% Minor Decrease (decrease 5 to 10%) 60269 9.9% Little Change (between -5 and +5%) 343420 56.9% Minor Increase (increase 5 to 10%) 72695 12.1% Increase (increase 10 to 20%) 70061 11.6% Major Increase (increase > 15%) 33456 5.6% All Land Pixels 606222 100%
Table – North Africa Change Classification (% Change) # of Pixel % of Land Pixels Major Decrease (decrease > 20%) 502 0.1% Decrease (decrease 10 to 20%) 2081 1.4% Minor Decrease (decrease 5 to 10%) 9173 6.2% Little Change (between -5 and +5%) 125815 85.6% Minor Increase (increase 5 to 15%) 4645 3.2% Increase (increase 10 to 20%) 3067 2.1% Major Increase (increase > 15%) 1710 1.2% All Land Pixels 146993 100%
Vegetation Change in North AfricaGIMMS Data - 1982 - 2003 • Change is highly variable year to year • Few Persistent Changes
North Africa – Same Areas of DeclineGIMMS Data, 1982/3 – 2002/3
India South Interior KarnatakaAnnual Integrated NDVI Annual Rainfall
North Africa – Areas of Increase1 – West Nile Delta, 2 – North Central Algeria, 3 – Atlas Mountains, 4 – South Morocco
North Africa – Areas of Increase1 – West Nile Delta, 2 – North Central Algeria, 3 – Atlas Mountains, 4 – South Morocco
Conclusions • Unlike other parts of the world, patterns of declining photosynthesis (NDVI) in North Africa are highly variable – with few areas of persistent change. • Climate must be the major driver of change for most of the region.
Conclusions • Areas in Morocco indicated in the literature as suffering from desertification – also have patterns of great variability. • The influence of human activity is hidden by strong climate variability.
Conclusions • There are some regions in North Africa which do show signs of persistent increase. • Like other regions of the world, the main driver of persistent increases in photosynthesis (NDVI) is agriculture and in particular related water resources. • Future research will focus on analysing precipitation data for North Africa with NDVI data. • .