Download
1 / 31

E N D
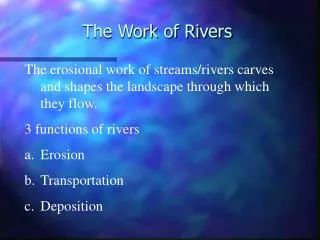
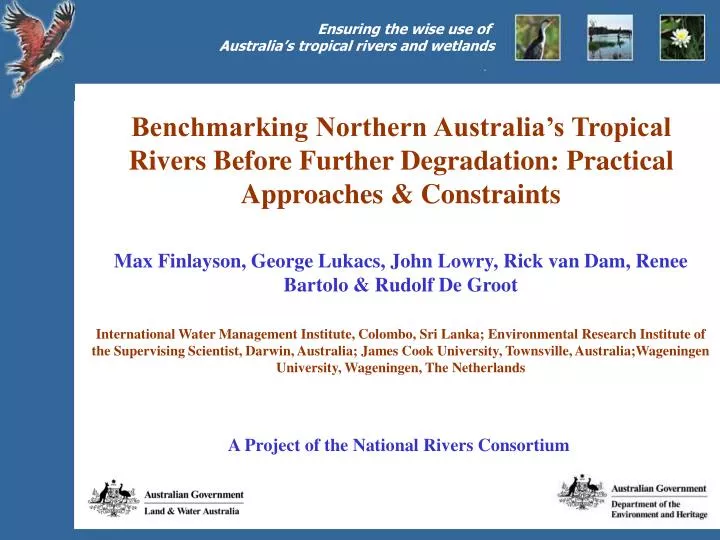
Benchmarking Northern Australia’s Tropical Rivers Before Further Degradation: Practical Approaches & ConstraintsMax Finlayson, George Lukacs, John Lowry, Rick van Dam, Renee Bartolo & Rudolf De GrootInternational Water Management Institute, Colombo, Sri Lanka; Environmental Research Institute of the Supervising Scientist, Darwin, Australia; James Cook University, Townsville, Australia;Wageningen University, Wageningen, The Netherlands A Project of the National Rivers Consortium
Aim & Objectives Aim: to better inform natural resource managers and decision-makers about the status of the rivers and wetlands in northern (tropical) Australia Objectives: provide an information base for determining management priorities • undertake (collate) a multiple-scale inventory of the habitats and biota of the rivers and wetlands • undertake risk assessments of the major pressures on the habitats and biota of the rivers and wetlands • develop and test a framework for analysis of the ecosystem services (e.g. provision of water for multiple uses), provided by the rivers and wetlands of northern Australia
Practical Approaches & Constraints Constraints: • information base is fragmented, and/or inaccessible, and insufficient for addressing management needs • research/assessment capacity is limited, centralised and bureaucratic and/or academic • local communities and indigenous people often not effectively engaged and/or empowered • driven largely be agendas from southern Australia Practical Approaches: • invest in ongoing stakeholder relationships • recognise, share and exchange information from multiple sources • make better use of and identify weaknesses in existing data • use (and improve) proven structured data collation and analytical approaches
Land & Water Australia (2004) Tropical Rivers Project Area FOCAL CATCHMENTS Daly (NT) Fitzroy (WA) • 51 catchments • 1,190,973 km2 • 3 focus catchments – Fitzroy, Daly & Flinders Flinders (Qld)
Assessment Inventory Monitoring Environmental Impact Assessment Strategic Environmental Assessment Risk Assessment Rapid Assessment Vulnerability Assessment Economic Valuation Integrated framework for wetland inventory, assessment and monitoring at multiple-scales. Broad-scale Broad-scale Detailed
An integrated information base (inventory): Built upon: • consultation – involvement and recognition of multiple knowledge sources • sharing/exchange and analysis of existing information, and • specific investigations to provide further data As a reference for assessing change in the ecological character of the rivers/wetlands (habitats, species, and the ecosystem services they provide)
Inventory of the biological, chemical and physical features of rivers/wetlands • Consultation (ongoing) • Mapping:— includes 1:250 k across northern Australia— finer scales for focal catchments (1:100 k – 1:50 k) • Collate existing river-reach attribute data for GIS (geomorphology, water quality, hydrology, vegetation, birds, fish, invertebrates, reptiles and amphibians) • Determine classification for ecological characterisation and inventory of rivers, and extrapolate to GIS • Ground-truthing and sampling regimes for focal catchments (where identified and necessary) • Reporting
Tropical Rivers Project Landform Data
Location of gauging stations throughout the project area with a period of record at least 20 y.
Location of gauging stations within the Daly river catchment with at least 20 y of complete annual flow data.
Inter-annual variability of runoff (Left) and mean annual runoff (Right) of the streams within the Daly river catchment area.
Broad scale classification Focus-catchment scale classification Bedrock channel Bedrock channel Bedrock confined Bedrock-confined Alluvial Low sinuosity rivers Meandering rivers Floodouts Multiple channel rivers Wandering channel rivers Lake / swamp Non-channelised Swamp / waterbody dominated zone Estuarine Tidal
Sept Oct-Jan Feb-mid March mid March - April Records of seasonal occurrence of Little Curlew
Aboriginal cultural landscape – a living, cultural environment
Assessment of major pressures on rivers/wetlands • Within selected major catchments and at important sites • Collation of information on pressures (after consultations with stakeholders) • Database development and quantitative ecological risk assessments • Recommendations for risk reduction/management steps and monitoring
Problem formulation Issue/Hazard Assessment • Risk assessment & ranking • Effects/hazard assessment • Likelihood assessment Further investigations Monitoring Decision processes Alternative scenarios Risk management Making risk management decisions
Scale 3 Conceptual model for multiple pressures Scale 2 Scale 1 Infrastructure Fire Ferals Pr (Risk) = Pr (effects) x Pr (exposure) Mining Weeds Climate change
Transition states for wetland vegetation - water drawdown & flooded conditions - based on reproductive features. Annual, short-lived species Perennial, short-lived species seed seed seed seed adult adult adult adult extinct extinct extinct extinct Water drawdown Water drawdown Flooded Flooded How will increased external pressures affect the vegetation patterns and ecological character?
Project 3:Development of a framework for the analysis of ecosystem services provided by rivers/wetlands • Derive a framework and an initial database for analysing ecosystem services provided by aquatic ecosystems • Conducted by students from University of Wageningen (Netherlands) • Small budget project, regarded as a pilot study with no resources to apply elsewhere (outside of NT)
(6) Planning & Management Measures (5) Policy Analysis and Institutional Aspects Sub-project 1: Function analysis & .Ecological valuation (Sophie) (1) Ecosystem Functions/ Goods & Services 1. Regulation 2. Habitat 3. Production 4. Information 5. Carrier Sub-project 2: Socio-culturalvaluation (Bas) . Decision- Making Process (1) Ecological Values Based on ecological integrity Sub-project 3: Socio-economic . valuation (Clement) (4) Integrated Cost-Benefit Analysis Sub-project 4: Integrated cost-benefit . analysis (Olga) (2) Socio-cultural values Based on equity and cultural perceptions Sub-project 5: Policy analysis & . Institutional aspects (Pujan) Stakeholder Involvement (3) Economic Values Based on efficiency and cost-effectiveness Sub-project 6: Planning & . Management measures (Matt) Integrated assessment framework for project overview
Daly and Mary Rivers (NT) - 27 different functions (goods and services) • Provisioning services - agriculture (cattle, buffalo), horticulture, crocodile farming, aquaculture, mining; harvesting natural resources such as food, commercial and subsistence fishing, medicinal resources, ornamental resources • Supporting services - habitat for wildlife and as nursery areas • Regulating services - climate regulation, water supply (for flora, fauna and human use), regulating runoff, soil retention, soil formation, nutrient regulation and waste treatment • Cultural and amenity services: aesthetic information, recreation & tourism, spiritual and historic information, cultural and artistic information, and use in science and education.
Economic value of 10 of 27 main goods and service - estimated A$50.7 million for Mary River catchment (~A$ 450/ha) and A$82.4 million for Daly river catchment (~A$230/ha) • Low figure compared to literature ~ A$4000/ha/year • Economically most important functions - carbon sequestration A$87 million; water use A$46 million; agriculture/horticulture A$26.5 million; tourism A$21 million • Conservative approach - contribution of these wetland goods and services to the local community and the regional economy is much higher than the shown values