Download
1 / 24
250 likes | 386 Views
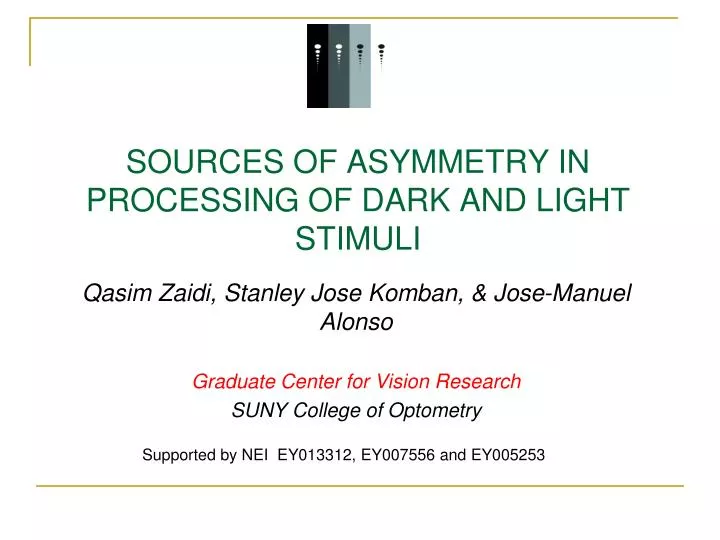
SOURCES OF ASYMMETRY IN PROCESSING OF DARK AND LIGHT STIMULI. Qasim Zaidi, Stanley Jose Komban, & Jose-Manuel Alonso Graduate Center for Vision Research SUNY College of Optometry. Supported by NEI EY013312, EY007556 and EY005253. Increments and decrements of light intensities don’t cohere.

E N D
SOURCES OF ASYMMETRY IN PROCESSING OF DARK AND LIGHT STIMULI Qasim Zaidi, Stanley Jose Komban, & Jose-Manuel Alonso Graduate Center for Vision Research SUNY College of Optometry Supported by NEI EY013312, EY007556 and EY005253
Increments and decrements of light intensities don’t cohere. • Conveyed by separate ON and OFF pathways in the visual system. • Does the visual system treat these inputs as equals differing only in polarity?
OFF Dominance of Neural Resources • (Macaque neurophysiology: noise+reverse-correlation) • OFF-center geniculate afferents dominate central V1 (Jin et al, Nat Neurosci 2008) • OFF responses dominate superficial layers of V1 (Yeh et al, J. Neurosci 2009) • Does behavioral evidence correlate with this asymmetry?
Detectability of increments and decrements • Thresholds for detecting negative contrasts reported lower than for positive contrasts (Blackwell, 1946; Chan & Tyler, 1992; Kontsevich & Tyler, 1999) . • Isolation of ON & OFF pathways requires controlling eye movements and adaptation
Detectability of increments and decrements No significant threshold differences between ON and OFF pathways at 16, 24, and 32 cpd (method of constant stimuli with the same contrasts). No significant accuracy difference between ON and OFF pathways at 100 % contrast over 6 observers (slight advantage for decrements at 32 cpd)
Adaptation behavior of ON and OFF pathways • Background shifted 0.5 or 1.5 times the mid-gray. • Same stimulus & procedure for discrimination threshold at 32 cpd. • Test presented 0 ms or100 ms after the background change. Step polarity Step polarity
Adaptation behavior of ON and OFF pathways • Contrast threshold for negative step change was significantly lower than for positive (Poot et al, JOSA 1997). • No consistent threshold difference for test polarity with adaptation change
Fast ON Fast OFF Fast ON t Fast OFF 1.2 0.8 Threshold (% contrast) 0.6 0.4 0.2 0 KJ AY Temporal-Sawtooth Waveforms Selectively activate ON & OFF retinal ganglion cells (Kremers et al, Vis Res 1997) • No consistent difference between ON &OFF contrast sensitivity at 8Hz in 2IFC task. • Consistent with ganglion cell measurements • Contradicts method of adjustmentpsychophysical data (Bowen et al, Vis Res 1989)
Any other Decrement/Dark advantages? Black-on-White better then White-on-Black in proof-reading (Buchner & Baumgartner, Ergonomics 2007) (not controlled for possible changes in pupil size, depth of focus etc). Primacy of Dark texels in judging variance of high contrast textures (Chubb & Nam, Vis Res 2000).
ON Dominance Reports • Primate ON retinal ganglion cell (RGC) responses are faster than OFF when stimulated with white noise (Chichilnisky & Kalmar J. Neurosci 2002) • Faster ON response explains illusory motion in anti-Glass patterns (Del Viva et al J. Neurophysiol 2006). • Does behavioral evidence correlate with this asymmetry?
Observers’ reaction times to Black and White targets on binary noise backgrounds • Reaction Times to detect number (1 to 3) of targets in uniform binary-noise. • Black/White target squares six times the size of the background texels. • 1600 trials/observer, spread across 4 sessions. • Observers seated 4.2m from the monitor. • Images subtended 3.84x5.12 degrees of visual angle. • 4 observers with corrected or 20/20 vision.
Observers’ reaction times to Black and White targets on binary noise backgrounds • Black targets processed significantly faster than White by all observers • (mean RT Black–mean RT White = 0.3, 0.2, 0.2, 0.2 s). • Dark targets were detected 97, 91, 90 and 91 % correctly and Lights 90, 77, 83 and 81 %, i.e. Dark RT advantage not due to sacrificing accuracy for speed. • RT histograms (bin size 0.1 s) fitted with Exponential-Gaussian function (MLE). • Post-hoc analysis for planned contrasts between mean RTs of Black and White.
Observers reaction times to Black and White targets on adjusted binary noise background • Despite physical equality, binary noise appeared to have more White area than Black (classical irradiation illusion). • To control for the irradiation illusion, we measured it with two methods: 1. Size of single White texel from the background presented on Black adjusted to achieve perceptual equality with the single Black texel on White. 2. Observers reported whether background had more White or Black area, while the Black/White proportion varied randomly to achieve subjective equality. Two methods converged to similar values for 3 out of 4 observers.
Observers reaction times to Black and White targets on adjusted binary noise background • Targets presented on irradiation-controlled binary backgrounds for each observer. • No significant differences in RT (Black–White = 0.03, 0.01, 0.05, 0.05 s). • Dark targets detected 86, 84, 87 and 84 % correctly, Lights 97, 90, 86 and 87 %. • Asymmetry in original RTs caused by the perceptual background inequalities.
Observers reaction times to Dark and Light targets on noise background with 9 luminance levels • Backgrounds: uniform distribution of 9 equally spaced luminance levels, similar to Chubb and Nam’s random textures. • Targets were uniform noise patterns with luminance values from the top 3 levels for Light and bottom 3 levels for Dark.
Observers reaction times to Dark and Light targets on noise background with 9 luminance levels • RTs for Dark targets significantly lower than for Light targets (Dark–Light = 0.57, 0.17, 0.20, 0.35 s). • Accuracy higher for Dark targets than Light (97, 89, 92 and 90 % versus 80, 58, 72 and 60 %). • Primacy of Black texels in the Chubb-Nam texture variance task could be due to greater salience in uniform noise backgrounds as a result of the irradiation illusion.
Possible Retinal Mechanism for Irradiation Illusion Campbell & Gubisch (1966) J Physiol
White on Black Black on White Stimulus Optical Blur Response Compression Center-Surround RGC output Model output using parameters adjusted to achieve empirical distortion [b=2.0; RF(ON) = RF(OFF)]
a b d c ON & OFF filter responses to Black & White targets on Physically equal and Perceptually Equal Binary Noise [b=2.0; RF(ON) = RF(OFF)]
Irradiation ratios for different ‘b’ and different ON and OFF RF sizes Distortion as a function of nonlinearity Distortion as a function of RF ratio in the absence of nonlinearity
Natural Scene Luminance Distributions • Skewed towards dark intensities (van Hateren et al, J Neurosci 2002) and negative contrasts (Ratliff et al, PNAS 2010) • Justification for increasing OFF neural resources (Balasubramanian & Sterling, J Physiol 2009) • Our results suggest instead that, similar to the irradiation-adjusted stimuli, the skewed histogram promotes similarity in responses to Light and Dark stimuli in everyday tasks.
Summary • We find no difference between sensitivity to Dark versus Light excursions when adapted to spatially uniform fields. • Darks are detected faster and more accurately than Lights in uniform spatial noise. • Spatial patterns are subject to the irradiation illusion and adjusting for it abolishes the advantage. • Early response nonlinearities can explain the irradiation illusion, and account for the Dark advantage, without resorting to differences in ON and OFF neural resources. • Asymmetry in luminance distributions of natural scenes towards dark values thus promotes equality between ON and OFF responses.
Implications • Psychophysical evidence in favor of Dark stimuli may be due to an early response nonlinearity rather than to differences in ON and OFF neural resources. • An early retinal locus for the irradiation illusion would distort physiological estimates of ON and OFF cell properties measured with spatial noise. • The skew of natural scene luminance distributions towards Darks, promotes similarity in responses to Light and Dark stimuli in everyday tasks, rather than being a justification for increasing OFF neural resources