Download
1 / 14
140 likes | 215 Views
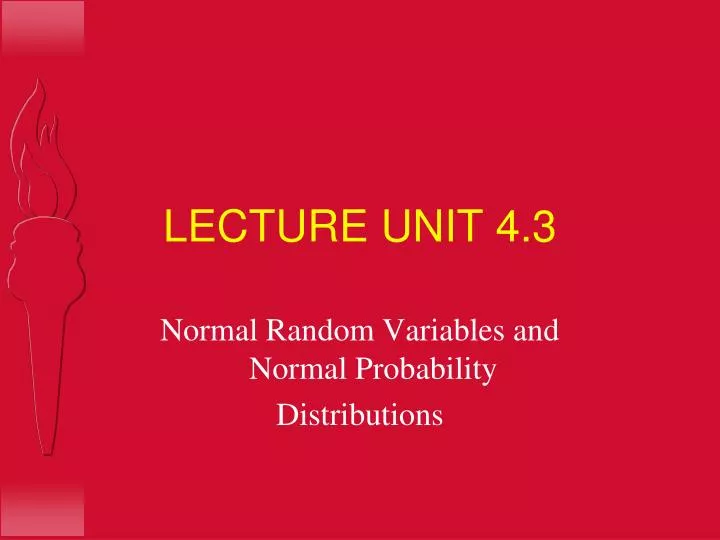
LECTURE UNIT 4.3. Normal Random Variables and Normal Probability Distributions. Understanding Normal Distributions is Essential for the Successful Completion of this Course. Recall: Probability Distributions p(x) for a Discrete Random Variable. p(x) = Pr(X=x) Two properties

E N D
LECTURE UNIT 4.3 Normal Random Variables and Normal Probability Distributions
Understanding Normal Distributions is Essential for the Successful Completion of this Course
Recall: Probability Distributions p(x) for a Discrete Random Variable • p(x) = Pr(X=x) • Two properties 1. 0 p(x) 1 for all values of x 2. all x p(x) = 1
The sum of all the areas is 1 p(5)=.246 is the area of the rectangle above 5 Graph of p(x); x binomial n=10 p=.5; p(0)+p(1)+ … +p(10)=1 Think of p(x) as the area of rectangle above x
Recall: Continuous r. v. x • A continuous random variable can assume any value in an interval of the real line (test: no nearest neighbor to a particular value)
Discrete random variable p(x): probability distribution function for a discrete random variable x Continuous random variable f(x): probability density function of a continuous random variable x Discrete rv: prob dist functionCont. rv: density function
Graphs of probability density functions f(x) • Probability density functions come in many shapes • The shape depends on the probability distribution of the continuous random variable that the density function represents
Graphs of probability density functions f(x) f(x) f(x) f(x)
P(a < X < b) Probabilities: area under graph of f(x) f(x) X b a P(a < X < b) = area under the density curve between a and b. P(X=a) = 0 P(a < x < b) = P(a < x < b)
f(x)0 for all x the total area under the graph of f(x) = 1 0 p(x) 1 p(x)=1 The sum of all the areas is 1 Total area under curve =1 Properties of a probability density function f(x) Think of p(x) as the area of rectangle above x f(x) x
1. 0 p(x) 1 for all values of x 2. all x p(x) = 1 values of p(x) for a discrete rv X are probabilities: p(x) = Pr(X=x); 1. f(x)0 for all x 2. the total area under the graph of f(x) = 1 values of f(x) are not probabilities - it is areas under the graph of f(x) that are probabilities Important difference