Download
1 / 1
10 likes | 133 Views
[NeII] Line Velocity Structure of Ultracompact (UC) HII Regions Y. K. Okamoto(Kitasato Univ.), H. Kataza (ISAS), T. Yamashita (Subaru Telescope), T. Onaka, T. Miyata, S. Sako, M. Honda (Univ. of Tokyo), T. Fujiyoshi (Subaru Telescope). [NeII]. [ArIII]. Offset Dec. [arcsec]. [SIV].

E N D
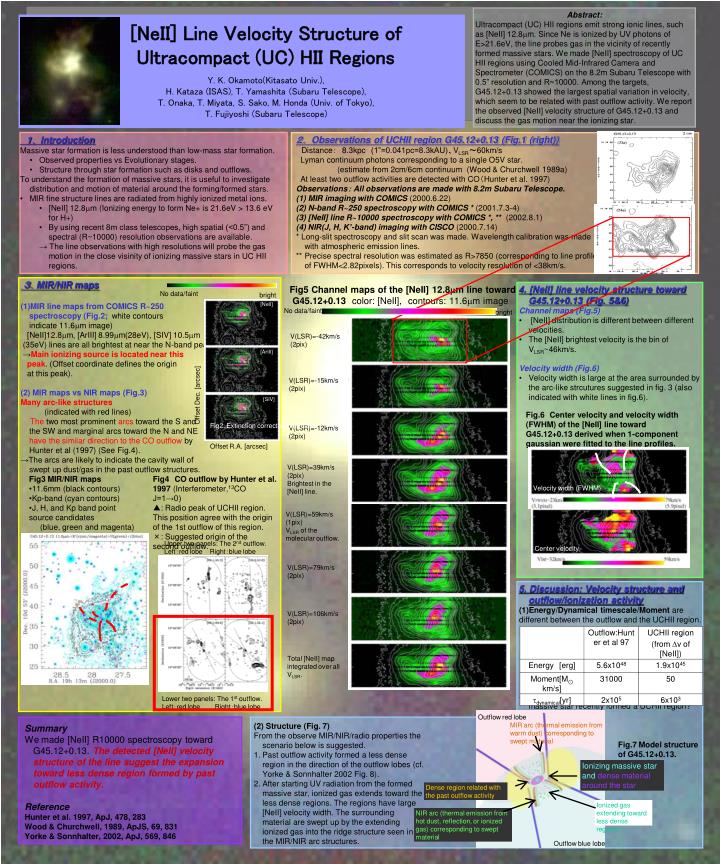
[NeII] Line Velocity Structure of Ultracompact (UC) HII RegionsY. K. Okamoto(Kitasato Univ.), H. Kataza (ISAS), T. Yamashita (Subaru Telescope), T. Onaka, T. Miyata, S. Sako, M. Honda (Univ. of Tokyo),T. Fujiyoshi (Subaru Telescope) [NeII] [ArIII] Offset Dec. [arcsec] [SIV] No data/faint bright Fig2. Extinction corrected line maps. Offset R.A. [arcsec] Center velocity Velocity width (FWHM) Abstract: Ultracompact (UC) HII regions emit strong ionic lines, such as [NeII] 12.8mm. Since Ne is ionized by UV photons of E>21.6eV, the line probes gas in the vicinity of recently formed massive stars. We made [NeII] spectroscopy of UC HII regions using Cooled Mid-Infrared Camera and Spectrometer (COMICS) on the 8.2m Subaru Telescope with 0.5” resolution and R~10000. Among the targets, G45.12+0.13 showed the largest spatial variation in velocity, which seem to be related with past outflow activity. We report the observed [NeII] velocity structure of G45.12+0.13 and discuss the gas motion near the ionizing star. • 1. Introduction • Massive star formation is less understood than low-mass star formation. • Observed properties vs Evolutionary stages. • Structure through star formation such as disks and outflows. • To understand the formation of massive stars, it is useful to investigate distribution and motion of material around the forming/formed stars. • MIR fine structure lines are radiated from highly ionized metal ions. • [NeII] 12.8mm (Ionizing energy to form Ne+ is 21.6eV > 13.6 eV for H+) • By using recent 8m class telescopes, high spatial (<0.5”) and spectral (R~10000) resolution observations are available. • → The line observations with high resolutions will probe the gas motion in the close visinity of ionizing massive stars in UC HII regions. • 2. Observations of UCHII region G45.12+0.13 (Fig.1 (right)) • Distance: 8.3kpc(1”=0.041pc=8.3kAU)、VLSR~60km/s • Lyman continuum photons corresponding to a single O5V star. • (estimate from 2cm/6cm continuum (Wood & Churchwell 1989a) • At least two outflow activities are detected with CO(Hunter et al. 1997) • Observations: All observations are made with 8.2m Subaru Telescope. • MIR imaging with COMICS (2000.6.22) • N-band R~250 spectroscopy with COMICS * (2001.7.3-4) • [NeII] line R~10000 spectroscopy with COMICS *, ** (2002.8.1) • NIR(J, H, K’-band) imaging with CISCO (2000.7.14) • * Long-slit spectroscopy and slit scan was made. Wavelength calibration was made with atmospheric emission lines. • ** Precise spectral resolution was estimated as R>7850 (corresponding to line profile of FWHM<2.82pixels). This corresponds to velocity resolution of <38km/s. • 3.MIR/NIR maps • MIR line maps from COMICS R~250 • spectroscopy (Fig.2; white contours • indicate 11.6mm image) • [NeII]12.8mm, [ArIII] 8.99mm(28eV), [SIV] 10.5mm • (35eV) lines are all brightest at near the N-band peak. • →Main ionizing source is located near this • peak. (Offset coordinate defines the origin • at this peak). • (2) MIR maps vs NIR maps (Fig.3) • Many arc-like structures • (indicated with red lines) • The two most prominent arcs toward the S and • the SW and marginal arcs toward the N and NE • have the similar direction to the CO outflow by • Hunter et al (1997) (See Fig.4). • →The arcs are likely to indicate the cavity wall of • swept up dust/gas in the past outflow structures. • 4. [NeII] line velocity structure toward G45.12+0.13 (Fig. 5&6) • Channel maps (Fig.5) • [NeII] distribution is different between different velocities. • The [NeII] brightest velocity is the bin of VLSR~46km/s. • Velocity width (Fig.6) • Velocity width is large at the area surrounded by the arc-like strcutures suggested in fig. 3 (also indicated with white lines in fig.6). Fig5 Channel maps of the [NeII] 12.8mm line toward G45.12+0.13 color: [NeII], contours: 11.6mm image No data/faint bright V(LSR)=-42km/s (2pix) V(LSR)=-15km/s (2pix) Fig.6Center velocity and velocity width (FWHM) of the [NeII] line toward G45.12+0.13 derived when 1-component gaussian were fitted to the line profiles. V(LSR)=-12km/s (2pix) V(LSR)=39km/s (2pix) Brightest in the [NeII] line. • Fig3 MIR/NIR maps • 11.6mm (black contours) • Kp-band (cyan contours) • J, H, and Kp band point source candidates • (blue, green and magenta) Fig4CO outflow by Hunter et al. 1997 (Interferometer,13CO J=1→0) ▲: Radio peak of UCHII region. This position agree with the origin of the 1st outflow of this region. ×: Suggested origin of the second outflow. V(LSR)=59km/s (1pix) VLSR of the molecular outflow. Upper two panels: The 2nd outflow. Left:red lobe Right:blue lobe V(LSR)=79km/s (2pix) • 5. Discussion: Velocity structure and outflow/ionization activity • Energy/Dynamical timescale/Moment are • different between the outflow and the UCHII region. • →Outflow was driven in the past and the central massive star recently formed a UCHII region? V(LSR)=106km/s (2pix) Total [NeII] map integrated over all VLSR. Lower two panels: The 1st outflow. Left:red lobe Right:blue lobe Outflow red lobe • (2) Structure (Fig. 7) • From the observe MIR/NIR/radio properties the scenario below is suggested. • Past outflow activity formed a less dense region in the direction of the outflow lobes (cf. Yorke & Sonnhalter 2002 Fig. 8). • After starting UV radiation from the formed massive star, ionized gas extends toward the less dense regions. The regions have large [NeII] velocity width. The surrounding material are swept up by the extending ionized gas into the ridge structure seen in the MIR/NIR arc structures. MIR arc (thermal emission from warm dust) corresponding to swept material Summary We made [NeII] R10000 spectroscopy toward G45.12+0.13. The detected [NeII] velocity structure of the line suggest the expansion toward less dense region formed by past outflow activity. Reference Hunter et al. 1997, ApJ, 478, 283 Wood & Churchwell, 1989, ApJS, 69, 831 Yorke & Sonnhalter, 2002, ApJ, 569, 846 Fig.7 Model structure of G45.12+0.13. Ionizing massive star and dense material around the star Dense region related with the past outflow activity Ionized gas extending toward less dense regions NIR arc (thermal emission from hot dust, reflection, or ionized gas) corresponding to swept material Outflow blue lobe