Download
1 / 4
40 likes | 123 Views
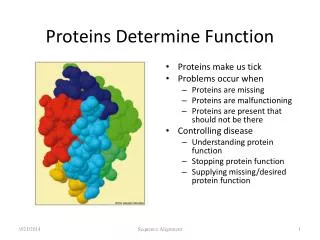
Autocorrelation calculated by :. Notice: The peak of the function =1 (its an autocorrelation) The triangular shape is a result of zero padding The secondary peaks mean the signal has some repetition. retinal ganglion cell responses to a fluctuating light stimulus.

E N D
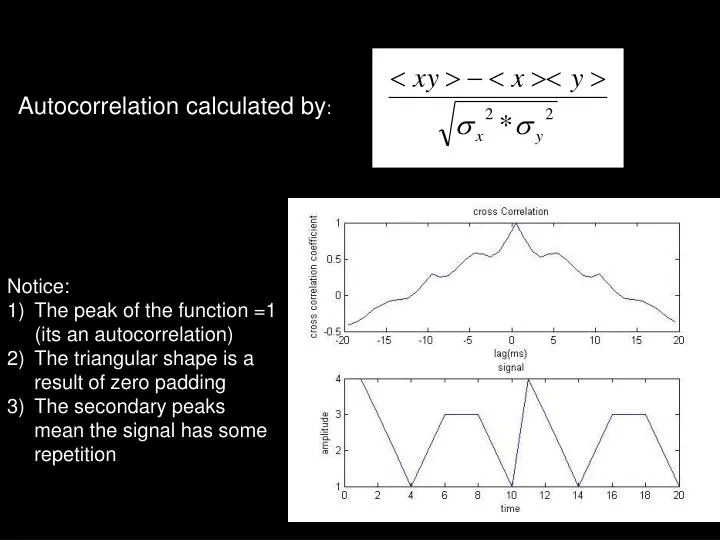
Autocorrelation calculated by: • Notice: • The peak of the function =1 • (its an autocorrelation) • The triangular shape is a result of zero padding • The secondary peaks mean the signal has some repetition
retinal ganglion cell responses to a fluctuating light stimulus
The peaks of the cross correlation functions using Matlab’s “xcorr” Offt, On Offs, On cross correlation coefficient Offs, Offt Offt, Offs Time (ms)
Using the Fourier transform to calculate the cross correlation A = fft (signal a) B = fft (signal b) Fourier Cross Correlation = ifft(A*conj(B))