Download
1 / 39
390 likes | 537 Views
STAT131 Week 3 Lecture 2 Least Squares regression. Anne Porter alp@uow.edu.au. Bivariate relationships. E xamples of questions regarding bivariate data are : Is there a relationship between one quantitative variable & another quantitative variable?

E N D
STAT131Week 3 Lecture 2 Least Squares regression Anne Porter alp@uow.edu.au
Bivariate relationships Examples of questions regarding bivariate data are: • Is there a relationship between one quantitative variable & another quantitative variable? • Is there a corrrelation between oxygen uptake & heart rate?
Scatterplots • These are used to portray the visual relationship. • For example: there may be a positive relationship between two quantitative variables oxygen intake and heart rate. Meaning as heart rate increases oxygen intake also increases. Scatterplots reveal 1. 2. 3. 4.
Scatterplots • These are used to portray the visual relationship. • For example: there may be a positive relationship between two quantitative variables oxygen intake and heart rate. Meaning as heart rate increases oxygen intake also increases. • Scatterplots reveal • Whether there is evidence of nonlinearity • Approximate strength and direction of the relationship • Whether there are any bivariate outliers • Whether any points are likely to be influential
Pearson’s Correlation coefficient r • Measures the direction and strength of thestraight line relationship • r can take on values from -1 to 1 • a random scatter of points will give a correlation close to 0 • a scatterplot must be used to see if using the correlation is (in)appropriate ie evidence of nonlinearity • there are many equivalent formulae for calculating r
Fitting a line through AIDS incidence data Why might we want to do this?
Prediction Models of existing data May be useful for prediction BUT
Many models may fit the data So how will we choose? Aids Incidence in NZ
Many models may fit the data So how will we choose? This will in part depend Upon the discipline Experts and what they know about the behaviour of the variable Aids Incidence in NZ
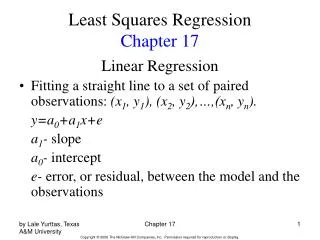
Form of a relationship • If variables can be classified as a response (y axis) and an explanatory variable (x axis) • Then we may want to describe the mathematical form of the relationship • The simplest form being the equation of a straight line (In SPSS, and the Social Sciences response and explanatory are referred to as the dependent and independent variables – not to be confused with probability!)
Possible procedure • Put in a line, • measure the vertical distances from points to lines, • square them, • sum the squared distances, • repeat the process until we have the best fitting line • that is the line with the smallest sum of squared distances. • Fortunately we do not have to go through an iterative process to do this, we can use the mathematics of fitting lines to data.
Least squares regression line Minimise Minimise the sum of the squared residuals
Caution extrapolation • Take care when extrapolating beyond the domain of the data upon which the model was developed. • Do not use models built on one population to predict for another eg models built for males are probably not suitable for females
Fig 1. Relationship between the Australian $ & English pound (Both in $US) • What is the nature of the relationship? As the value of the Pound (in $US) increases the value of the Australian $ (in $US) decreases English Pound (Value in $US)
Number of (x,y) pairs Probability rounded of getting this correlation if it were really zero Reveals a moderate negative correlation As the pound increases the Australian dollar decreases Correlation Coefficients - -What does the output mean?
Fig 1. Relationship between Australian $ & English pound (Both in $US) • What is the form of the relationship? • What does the slope look like it will be ? Negative As one variable increases the other decreases English Pound (Value in $US)
Fig 1. Relationship between Australian $ & English pound 2 • What is the intercept with the y axis –imagine the line. English Pound (Value in $US)
If the x axis goes through 0 we can read the approximate value of the y intercept, otherwise extrapolate the x axis too Fig 1. Relationship between Australian $ & English pound 2 • What is the intercept with the y axis –imagine the line. - about 2 English Pound (Value in $US)
Interpreting the output Use it to write the equation of the line predicting the Australian $ ------------------ Variables in the Equation ------------------
Explanatory variable (x) Intercept with y axis A_DOLLAR=1.986862-.004793xE_POUND (about 2.0) OUPUT ------------------ Variables in the Equation ------------------
Explanatory variable (x) Intercept with y axis A_DOLLAR=1.986862-.004793xE_POUND OUPUT ------------------ Variables in the Equation ------------------
OUTPUT Variable(s) Entered on Step Number 1.. E_POUND Multiple R .76471 R Square .58477 Adjusted R Square .56817 Standard Error .16689 Analysis of Variance Proportion of variation In Aust $ y that can be explained in terms ofthe English pound (x) Measure of variation F = 35.20823 Signif F = .0000
It is easy to get it wrong by specifying the wrong variables to be x and y ------------------ Variables in the Equation ------------------ Not near 2.0 as the graph suggested
Regression • Correct results need correct explanatory (x) and response (y) variables. • If appropriate, the response variable can be predicted from the equation of the straight line • There are assumptions we need to check to assess adequacy of the model. • If F signif is not very small, say <.05 then the equation/model is not useful.
Regression • The correlation squared is the proportion of variation in one variable that can be explained in terms of the other. • if r=0.9 then r2= 0.81. • 81% of the variation in y can be explained in terms of x • 19% of the variation in y scores can not be explained.
Regression • If the regression line is good • Explains a large proportion of variation • Explains more variation than other studies • F is significant • The value of x is in the domain on which the model is based • Then we can use it to predict responses with the equation
Mathematics of fitting lines through many points Equation of the line Slope Intercept on y axis You MUST correctly specify y the response variable and x the explanatory variable correctly
Simple example • Find the form of the relationship between the number of siblings (x) and the number of bedrooms (y) Siblings (x) Bedrooms (y) 0 1 2 4 3 5 2 3 What should we do first?
Beds 5 4 3 2 1 0 0 1 2 3 4 Siblings Simple example • Find the form of the relationship between the number of siblings (x) and the number of bedrooms (y) Siblings (x) Bedrooms (y) 0 1 2 4 3 5 2 3 x x x x What should we do first?
Simple example • Doing the mathematics to find and to substitute in Siblings (x) Bedrooms (y) 0 1 2 4 3 5 23 7 13 x2 xy
Simple example • Doing the mathematics to find and to substitute in Siblings (x) Bedrooms (y) 0 1 2 4 3 5 23 7 13 x2 xy 0 8 15 6 0 4 9 4 17 29
Simple example 13/4=3.25 • Doing the mathematics to find 7/4=1.75 and to substitute in x2xy Siblings (x) Bedrooms (y) 0 1 2 4 3 5 23 7 13 0 4 9 4 0 8 15 6 17 29
Simple example • Doing the mathematics to find and to substitute in x2 xy Siblings (x) Bedrooms (y) 0 1 2 4 3 5 23 7 13 0 4 9 4 0 8 15 6 17 29
is the predicted value of y Simple example • We can use • And • To predict the value of y given a value of x by substituting in • When x =1 sibling we predict • When X=2 we predict bedrooms • When X=10 we are predicting outside the range of the data that was used to develop the model. Caution!
is the predicted value of y Simple example • We can use • And • To predict the value of y given a value of x by substituting in • When x =1 sibling we predict • When X=2 we predict bedrooms • When X=10 we are predicting outside the range of the data that was used to develop the model. Caution!
Next Lecture Probability Assignment1 may now be completed