Download
1 / 34
340 likes | 489 Views
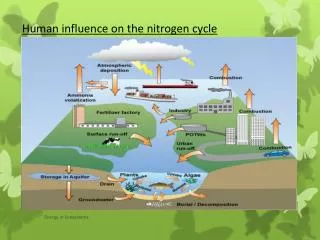
Influence of Catchment Characteristics on Stream Nitrogen Transport to the Hood Canal. Osborne, S.N.; Brett , M.T.; Richey, J.E.; Steinberg, P.D.; Newton, J. A.; and Hannafious, D. Hood Canal Dissolved Oxygen Program University of Washington. Outline. General Watershed Characteristics

E N D
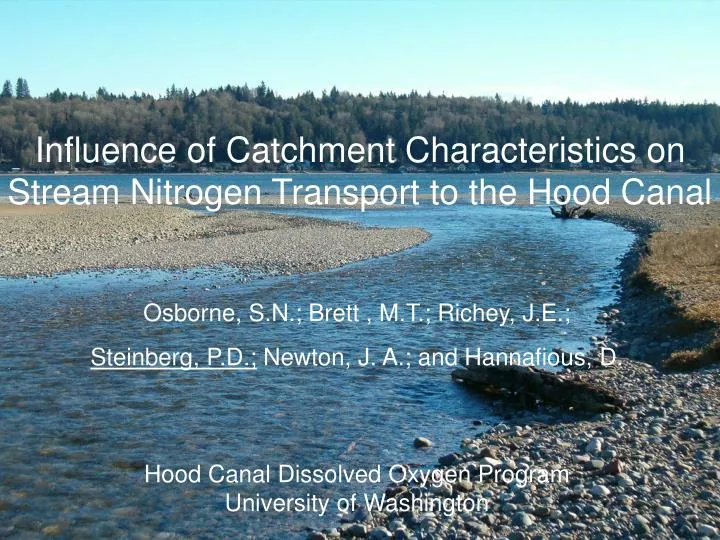
Influence of Catchment Characteristics on Stream Nitrogen Transport to the Hood Canal Osborne, S.N.; Brett , M.T.; Richey, J.E.; Steinberg, P.D.; Newton, J. A.; and Hannafious, D. Hood Canal Dissolved Oxygen Program University of Washington
Outline • General Watershed Characteristics -Hydrology -Land Cover • Study Objectives -Estimate freshwater N loads (possible cause of Hood Canal hypoxia) • Results -Seasonal variation in N loads/concentrations -Land cover effects on load/concentrations -Discharge effects on load/concentrations
Watershed Characteristics • Drainage Basin Area • Hood Canal Watershed (2119 km2) • Individual Catchments (35) • (0.05 to 628 km2) • Slope • Individual Catchments • (2.6 to 30.3 degrees)
Watershed Characteristics Land Cover • 14 Categories • Dominant LC Types Hood Canal Watershed: • Mature Conifer (48.2%) • Deciduous/Mixed (10.9%) • Young Conifer (8.3%) • Sub-Alpine Forest (5.5%)
Study Objectives • Estimate total freshwater nitrogen loading to Hood Canal • Identify seasonal trends in surface water nutrient concentrations and loading • Examine the effect of catchment characteristics on nutrient transport (i.e. land cover, soil type, drainage basin area, slope, and discharge) • Compile a dataset that can be used to develop and calibrate a watershed biogeochemical model
Methods • Analytes (Monthly Sampling and Storm Event Sampling): • Dissolved Nutrients (ORP, NO3-N, NO2-N, NH4-N, and SiO4-Si) • Dissolved Organic Carbon & Total Dissolved Nitrogen • Particulate Organic Carbon & Total Particulate Nitrogen • Total Phosphorus • Total Suspended Solids 2) Data Management & QA/QC 3) GIS Analysis • Watershed and Individual Catchment Characteristics • Land Cover, Soil Type, Drainage Basin Area, Slope 4) Field Discharge Measurements and Hydrologic Modeling • Statistical Analysis of Data
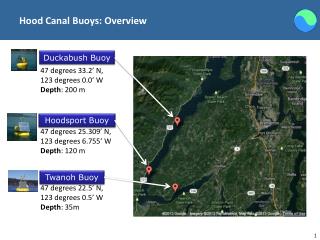
HCDOPMonthly Sampling Program • 38 Sampling Locations • ~80% of surface water discharge to Hood Canal
2005: 935 metric tons TN (Dry year) Total Dissolved Nitrogen (760 mt/yr) Particulate Nitrogen (175 mt/yr) (DIN ~ 75% of TDN = 570 metric tons) TDN Composition Nitrate-N (68±19%) DON (24±16%) Ammonium-N (7±11%) Nitrite-N (0.3±0.2%) 1990-2004 Averages Discharges with 2005 Nutrient Data 1250200 metric tons TN (750 130 metric tons DIN) USGS Preliminary Assessment/Prediction 421 ± 162 metric tons (DIN) ResultsNitrogen Load from Hood Canal Streams
2005 Nitrogen Concentrations and Speciation for Hood Canal Streams
Seasonality of Nitrogen Loads and Concentrations • Peaks of loading and flow-weighted concentrations occur during rainy months • Dry January/February 2005 resulted in lower loading and concentrations • Nitrate is dominant fraction of TDN during months of low biological uptake (winter & fall), DON is dominant fraction of TDN during months of high biological uptake (summer).
2005 Seasonal Cycle of Nitrogen Transport and Speciation in Hood Canal Streams
Seasonal Cycle of Nitrogen Loads from Rivers/Streams to Hood Canal (2005)
Land Cover Effects on TDN Concentrations -Deciduous Mixed Forest Cover Type: Red alder (Alnus rubra), a nitrogen fixer, is a major species. -Low to medium density residential areas (with septic systems) are included Deciduous Mixed Forest type at this resolution
Influence of Deciduous/Mixed & Mature Conifer Forests on Nutrient Concentrations • Nutrient Rich: TDN > 600 mg/L • Nutrient Poor: TDN < 150 mg/L
Deciduous Mixed Forest Rainwater reference Mature Conifer Forest Rainwater reference
Other Characteristics of Nutrient Poor Streams • 8 of the 12 streams identified as nutrient poor are located on the west shore of Hood Canal. West shore streams have: • Larger average watershed areas (49.4 km2 vs. 5.7 km2), • Headwaters in Olympic National Park • Higher average discharges (1.9 vs. 0.3 m3/s) • Greater average slopes (19.9 vs. 6.5 degrees) • Lower average nitrogen concentrations and greater loads
Next Step: Estimating Storm Event Effects on Nutrient Concentrations • Sample streams every 2 – 4 hours during 2 – 4 day storm events • Estimate discharge effects on nutrient concentrations • Refine N loading estimates
100% ~800%
100% ~800% ~150%
100% ~800% <50% ~150%
Conclusions 1) Land cover (vegetation and land use) influences stream nutrient transport. -Catchments dominated by Mature Conifer Forest retained nitrogen more efficiently. -Catchments dominated by Mixed Deciduous Forest had higher nitrogen concentrations. -Catchments dominated by Open Forest Regrowth had higher particulate nitrogen concentrations.
Conclusions cont. 2) Larger rivers with headwaters in Olympic National Park (predominantly mature conifer forest) were typically associated lower N concentrations, but larger N loads 3) In stream nitrogen concentrations were generally low (<1 mg/L) and nitrate was the dominant fraction of TDN. 4) Stream nitrogen concentrations patterns are strongly seasonal. 5) Total surface freshwater N load is higher than initial estimates.