Download
1 / 31
310 likes | 514 Views
Linder Theory continued. Assumptionsconsumer tastes depend on per capita income level(per capita means per head, or per person)production at home depends on tastestrade is a by-product of the home market's production and consumption patternSo, in a country with some inequality, the goods demand

E N D
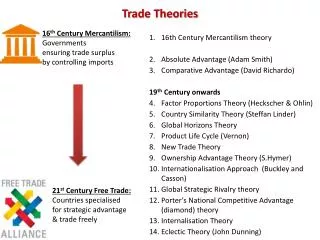
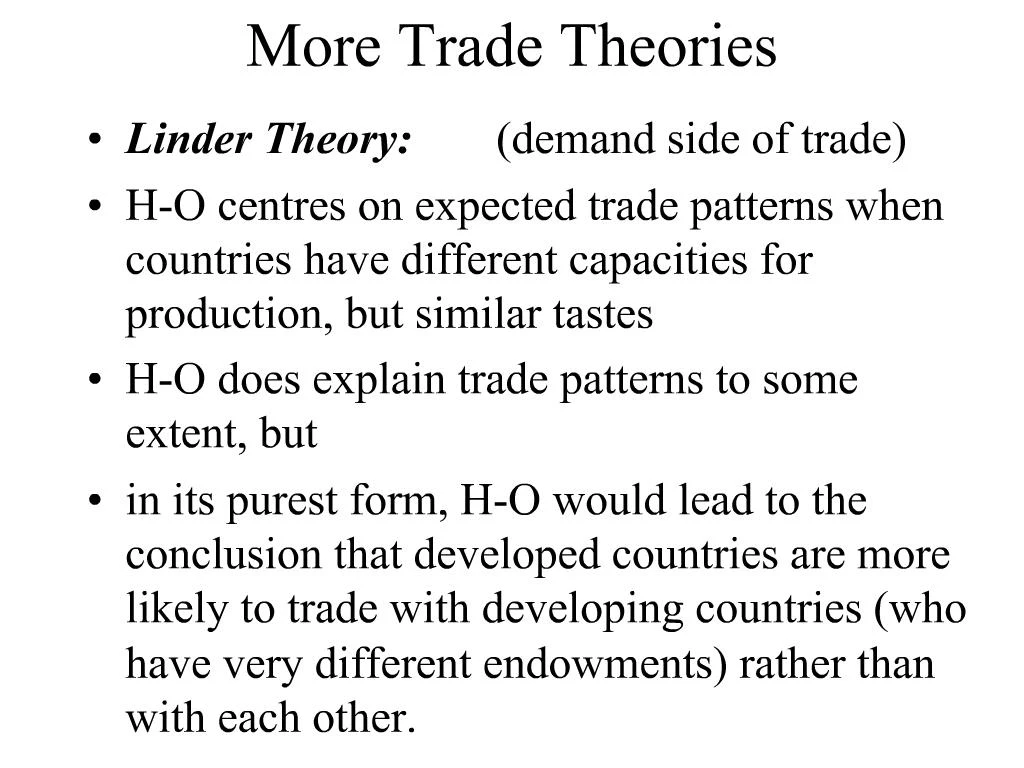
1. More Trade Theories Linder Theory: (demand side of trade)
H-O centres on expected trade patterns when countries have different capacities for production, but similar tastes
H-O does explain trade patterns to some extent, but
in its purest form, H-O would lead to the conclusion that developed countries are more likely to trade with developing countries (who have very different endowments) rather than with each other.
2. Linder Theory continued Assumptions
consumer tastes depend on per capita income level
(per capita means per head, or per person)
production at home depends on tastes
trade is a by-product of the home market�s production and consumption pattern
So, in a country with some inequality, the goods demanded will reflect the tastes of people at varying levels of income, and
the goods produced will depend on the size of the market demand
3. Linder Theory - Example Let goods produced (and consumed) by country I be ordered according to quality:
A, B, C, D, E - A lowest, E highest
Let country II have income distribution that fits demand for goods C, D, E, F and G
Then, trade would occur in goods C, D, E, where both countries have a demand for the good
we would therefore expect most trade to be intra-industry trade (countries should both import and export the same goods)
4. Linder Theory - Example Let country III have income such that it produces goods E, F, G, H, and I
Country III will trade goods E, F, G with country II
Country III will trade only good E with country I
THEREFORE, countries will trade together more, if they have similar per capita incomes,
MOST trade will be intra-industry trade, and
with this theory, we cannot predict the pattern of trade (which country will export more/less of which good
6. Linder Theory - tests and implications tests of Linder theory have shown it to be a good predictor of trade
Problem
it can�t predict patterns, nor volumes
7. Kemp Model Kemp model - implications of increasing returns to scale
Two goods and two countries, (goods X and Y)
both goods have increasing returns to scale in production
economies of scale are such that the ppf is convex to the origin (economies of scale do not always imply a convex ppf)
economies of scale are EXTERNAL to the firm, and pertain to the industry
8. Kemp - continued there are three possible equilibria
1. only good X is produced
2. only good Y is produced
3. both goods are produced, and ppf is tangent to indifference curve (NOT A STABLE equilibrium)
If economy happens to be at equilibrium 3, and country starts to trade, it will move to either 1 or 2, depending on the terms of trade.
pattern of trade may depend on historical accident, since for some TOT production of either good is preferable to production of both goods
10. Kemp - continued In the diagram -
At TOT1 only X is produced
At TOT2 only Y is produced,
At TOT3 either only X, or only Y or some mixture is produced (who knows)
note: the middle equilibrium is unstable, and can only occur by coincidence
With economies of scale if two countries have same ppf and same tastes and therefore same PX/PY they can still gain from trade
12. Krugman Model model of intra-industry trade under monopolistic competition with product differentiation
13. Krugman Model
monopolistic competition - each firm acts like a monopolist, (unique product), but the presence of many close substitutes causes economic rents to disappear
product differentiation - the creation of a separate identity for a product that is not in fact unique, usually through advertising, and the encouragement of brand loyalty
14. Monopolistic Competition Firm behaves as a monopoly, facing a downward sloping demand curve
Firm chooses BOTH quantity to produce AND price to charge
MR downward sloping, not MR=P
Firm�s quantity of output determined by MR=MC, charges highest price it can at that output
In the short-run firm makes profit (shaded area)
In the long run AC shifts up (or demand shifts left) and profits disappear
16. Krugman�s model firms experience economies of scale in production
simple presentation includes only labour as factor of production. For firm i,
Li = a + bQi example: L3 = 20 + 2 Q3
With this equation, the cost of production is
C = WLi = W(a + bQi)
Therefore the marginal cost of production is:
MC = Wb
17. Krugman�s model firms experience economies of scale in production
simple presentation includes only labour as factor of production. For firm i,
Li = a + bQi example: L3 = 20 + 2 Q3
With this equation, the cost of production is
C = WLi = W(a + bQi)
Therefore the marginal cost of production is:
MC = Wb
18. Krugman�s model firms experience economies of scale in production
simple presentation includes only labour as factor of production. For firm i,
Li = a + bQi example: L3 = 20 + 2 Q3
With this equation, the cost of production is
C = WLi = W(a + bQi)
19. Krugman�s model the cost of production is
C = WLi = W(a + bQi)
There is a fixed cost, Wa, and a variable cost WbQi
Therefore the marginal cost of production is:
MC = Wb
Marginal cost is constant
Average cost is Wa/Qi + Wb
Average cost is decreasing as output increases.
20. Elasticity of demand and MR Under monopolistic competition price depends on the elasticity of demand, and the marginal revenue
P = MR eD / (eD + 1)
If firm maximizes profit, MR = MC and so,
P = MC eD / (eD + 1)
Derive P = MR eD / (eD + 1)
22. Basic Krugman Diagram Look at relationship between per capita consumption of a product and P/W (real cost to purchaser)
First: PP curve
as consumption of a company�s good increases (demand increases), P/W for the good also increases because eD becomes less elastic as Q increases.
23. The ZZ curve ZZ curve - zero economic profit
profit : PQ-(a+bQ)W=0
PQ=(a+bQ)W
P/W=(a+bQ)/Q
P/W=a/Q+b
or, let the total population = LT, and they consume cLT
P/W=b+a/(cLT)
24. The ZZ curve As per capita consumption rises, output rises and brings scale economies.
reductions in unit cost lead to lower prices and zero economic profit
above ZZ curve profits are greater than zero
below ZZ curve profits are less than zero
and increase in LT shifts ZZ down, because, P/W increases for per a given per capita consumption, i.e. the more people there are, the lower the real price for the good due to economies of scale
26. Trade in the Krugman Model International trade allows economies of scale to be realized, more so than with limited or no trade
The ZZ curve moves down, P/W falls (meaning real wage W/P rises) because goods become cheaper.
Also, c drops for each good - per capita consumption decreases as more choice is available
However, total production of each good increases as more people buy it
27. Paul Krugman Will definitely win a Nobel prize sooner or later
is a major contributor (founder) of the school of �new trade theories�
examines trade under increasing returns to scale and the subsequent market systems arising from those returns: monopolistic competition and oligopoly
28. Intra-Industry Trade: Reasons product differentiation (see 173 types of cars)
transportation costs and geographic location
dynamic economies of scale -- two similar goods produced in two countries, each decreases production costs by learning by doing, the good gets a bigger share of market and is traded between countries
aggregation of classification
Differing income distribution - Linder idea, add possibility that country�s producers cater to main market, other parts of distribution buy imports
29. Oligopoly and reciprocal dumping A If a firm has a monopoly in home country and a second firm has a monopoly in its country,
each firm sells at monopoly prices at home
each firm sees potential profit selling in other country (price > MC)
each firm sells in other market, taking into account the behaviour of the previous monopolist.
there is intra-industry trade.
30. Gravity Model Predict volume of trade between 2 countries based on
national income for each country
distance
other variables, such as measure of economic integration (free trade agreements, etc), population, etc.
works for countries with similar income and intra-industry trade
31. Measuring Intra-Industry Trade (appendix B)
Let Xi be a country�s exports of good i
Let Mi be a country�s imports of good i
The measure of intra-industry trade for a country is:
32. Example Industry X M
A 1000 200
B 50 2000
C 500 400
Calculate intra-industry trade index for this economy