Download
1 / 26
260 likes | 359 Views
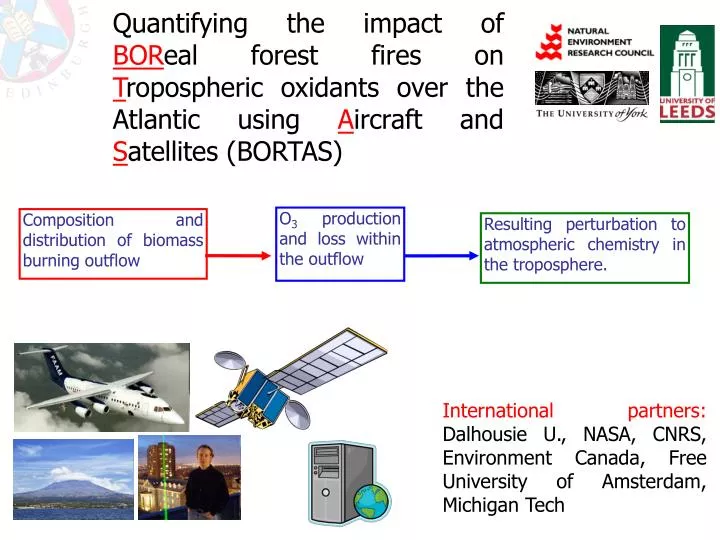
Quantifying the impact of BOR eal forest fires on T ropospheric oxidants over the Atlantic using A ircraft and S atellites (BORTAS). O 3 production and loss within the outflow. Composition and distribution of biomass burning outflow.

E N D
Quantifying the impact of BOReal forest fires on Tropospheric oxidants over the Atlantic using Aircraft and Satellites (BORTAS) O3 production and loss within the outflow Composition and distribution of biomass burning outflow Resulting perturbation to atmospheric chemistry in the troposphere. International partners: Dalhousie U., NASA, CNRS, Environment Canada, Free University of Amsterdam, Michigan Tech
Motivation • During ITOP, summer 2004, Canadian biomass burning plumes were intercepted in mid-Atlantic and Europe • Biomass burning airmasses showed an unusual mixture of organic compounds within NOy (NO+NO2+PANs+HNO3+NO3+2N2O5+organic nitrates) • Much NOy was held as PAN but its abundance was much higher than predicted by theory and very sensitive to temperature and altitude. • It appears that NOy speciation holds the key to understanding O3 tendency (net P or L?) in biomass burning plumes • No canonical O3:CO relationship
BORTAS measurement campaign • Aerosol numbers distributions, composition (AMS, SP2) • VOCs, alcohols, ketones, aldehydes, ethers (WAS) • NOy speciation (LIF) • HCN, HNO3, formic acid (CIMS) • O3 (UV-abs) • CH3CN/oxygenates (PTR-MS) • CO2, CH4, CO • j(NO2), j(O1D) • Semi-volatile VOCs • Based out of Halifax NS, Canada from 12 July to 3 August 2011. • FAAM BAe146 aircraft • 500 nautical mile range, approx. ceiling at 30000 ft • 15 flights (including science transit flights between UK and Canada via Azores, ~20 hours) • Support from ground-based, in situ, and satellite observations.
Support measurements for BORTAS Intensive sounding network:Links to Env. Canada, AEROCAN/AERONET (Sun photometer), CORALNet (Lidar) and Toronto Atmospheric Observatory (FTIR) Dalhousie Ground Station: Raman Lidar Sun photometerPARIS-IR FTIRPM2.5 NephelometerAMSWind profiler DA8 FTIR Ozone profiling Lidar • Daily ozonesonde launches: • Bratt’s Lake SKChurchill MBEgbert ONGoose Bay NLSable Island NSStony Plain ABYarmouth NS • Mt. Pico observatory, Azores:Ground-based measurement site in central Atlantic at 2200 m elevation.NRT measurements of ozone, CO, NOx, NOy, NMHCs, BC. • Satellite observations:IASI – NRT CO columns and profilesACE-FTS • TES special observations for North America/North Atlantic.
Flight plan for 21 July 2011 GEOS-5 CO from boreal biomass burning sources at 750 hPa Aircraft altitude Aircraft CO measurements [m] [ppbv] Aircraft altitude Altitude / km Time / day of year CO and acetonitrile CO / ppbv; CH3CN / pptv Time / day of year Observed biomass burning outflow: BORTAS flight B624 • Fifth research flight of the campaign, 21 July 2011. • Science plan to sample biomass burning plume in mid-lower troposphere over Island of Newfoundland and Gulf of St. Lawrence. • Flight plan superimposed over GEOS-5 CO forecast at 750 hPa. • Aircraft altitude and measured CO correlate with location of outflow predicted by GEOS-5.
GEOS-5 predicted boreal biomass burning outflow (forecast initialised on 20 July, midnight UTC) in mid to lower troposphere over Halifax starting just before midnight 21 July. Event coincided with BORTAS flight B623, which measured spiral profiles over Halifax, on 20 July. Layers of enhanced aerosol backscatter observed during aircraft spiral over Halifax and by Dalhousie lidar coincident to timing and altitude of predicted outflow. Two distinct layers observed at 2 km and 5km altitude correlate with enhanced CO and CH3CN. Observed vertical profiles of biomass burning outflow over Halifax Approx. altitude / km GEOS-5 CO from boreal biomass burning, 20110720_00z Dalhousie lidar [ppbv] CO / ppbv; CH3CN / pptv Green backscatter coefficient / ×10-4 Altitude / km Altitude / km Ascending spiral aircraft profile over Halifax ~0100 UTC, 21 July 2011 20 July, 12z 21 July, 00z 21 July, 12z
Observed ozone distribution shows peak concentrations at 25 ppbv (measurements below 3 km) and 50 ppbv (background in free troposophere). Ozone mixing ratios have range of approx. 20 ppbv at highest CO values. Higher ozone values at lower CO values indicate mixing of other sources? Stratospheric influence? No discernible difference between ozone in background and plume air masses. Ozone distribution observed during BORTAS Frequency O3 / ppbv O3 / ppbv CO / ppbv Parrington et al., in preparation
Nonmethane hydrocarbon ratios tell us something about tropospheric oxidation and transport processes. Widely reported in the literature from aircraft and surface measurements [e.g. Parrish et al. (1992, 2007), Honrath et al. (2008), Jobson et al. (1994)]. NMHC ratios (n-butane/ethane vs. propane/ethane) measured during BORTAS are consistent with reported values from previous campaigns. Slope of linear fit to all BORTAS data = 1.50 in the range 1.20 - 2.26 for individual research flights. Hydrocarbon ratios as indicators of photochemical processing of air masses Parrish et al. (1992) ln(n-butane/ethane) ICARTT ln(propane/ethane) ITCT 2K2 Parrish et al. (2007)
Photochemical ages calculated from ln(propane):ln(ethane) ratio and assuming mean OH mixing ratio of 2×10⁶ molecules/cm3. CO (VOC and LIF) measurements show similar ‘age spectra’ with largest peak at 2-3 days and secondary peak at 6-7 days. Ozone measurements show no obvious relationship with photochemical age. Estimate ozone production (or loss) from ratio of ozone enhancement over background, ΔO3, to ΔCO and ΔNOy. Photochemical age of plume measurements In plume Out of plume Parrington et al., in preparation
ΔO3/ΔCO measured during BORTAS aircraft campaign are consistent with observed ratios from previous measurement campaigns. Mean BORTAS values at higher end of reported means but median values in much better agreement possibly reflects large variability when considering all BORTAS research flights. At ages ≥5 days, mean and median BORTAS ratio more comparable to reported values for Siberian - indicates different emission source? NWT vs. NW Ontario? Need to verify source/age with back trajectories. This does not tell us anything about plume ozone chemistry. Evidence of ozone production in biomass burning outflow BORTAS Jaffe and Wigder (2012)
∑PNs CETEMPS Department of Physics University of L’Aquila, Italy , Italy ∑ANs Source and sink of O3 (slide from Piero Di Carlo) RO2 + NO → RO + NO2 RO’ + O2 → R’O + HO2 HO2 + NO → OH + NO2 2NO2+ hν + O2 → 2 O3 RO2 + NO → RONO2 ∑ANs is a good indicator of the photochemistry because O3 and ∑ANs have the same source ∑ANs
High values of ∑AN and low values of Ox indicate suppressed ozone production (~6 molecules of ozone per molecule of ∑AN) Low ∑AN and high Ox indicate higher photochemical ozone production (>500 molecules of ozone per molecule of ∑AN). Similar distribution for Ox vs. NOz indicating relationship between number of ozone molecules produced per molecule of NOx that is oxidized. Plotting ratio of Ox/NOz indicates “ozone forming potential” of measured air masses. Ox (O3+NO2) / ppbv Ox (O3+NO2) / ppbv ∑AN / ppbv NOz (NOy-NOx) / ppbv Towards understanding plume ozone chemistry ◇ nighttime, low aerosol ◆ daytime, low aerosol ◇ nighttime, high aerosol ◆ daytime, high aerosol Parrington et al., in preparation
NOx-limited VOC-limited Towards understanding plume ozone chemistry ◇ nighttime, low aerosol ◆ daytime, low aerosol ◇ nighttime, high aerosol ◆ daytime, high aerosol Ozone forming potential Ox/NOz NOx / ppbv Parrington et al., in preparation • The relationship between O3/NOz and NOx tells us something about the chemical regime within the measured plumes. • At high NOx, the plumes are in a VOC-limited regime with low OPE (i.e. freshly emitted plumes?). • At low NOx, the plumes are in a NOx-limited regime with higher OPE (i.e. aged plumes).
Plume enhancements of organic species show strong linear relationship relative to CO. No clear relationship for ozone. Hydrocarbon ratios are consistent with values reported in literature for previous measurement campaigns. Photochemical ages of observed biomass burning plumes calculated from propane:ethane ratio range from 0 to 10 days with peak CO, VOC, and NOy measurements at 2-3 days of ageing. Evidence of ozone production in biomass burning outflow: Ratios of ΔO3/ΔCO in the plume measurements show strong correlation (r > 0.7) to photochemical age in the free troposphere (2-8 km). Relationship between ozone and ∑AN/NOz indicates influence of NOy partitioning. Enhanced potential for ozone formation in aged plume air masses with low aerosol loading. Consistent picture seen in data from other measurement campaigns over the same region (ABLE 3B, ARCTAS), not shown. BORTAS campaign summary
Acknowledgements: BORTAS contributors • University of Edinburgh • Paul Palmer • Mark Parrington • Stephan Matthiesen • Rob Trigwell • Eddy Barratt • University of York • Ally Lewis • James Lee • Andrew Rickard • Sarah Moller • Steve Andrews • Peter Bernath • Keith Tereszchuk • University of Leeds • Jenny Young L’aquila University University of Manchester University of East Anglia • University of Toronto • Kaley Walker • Kim Strong • Cyndi Whaley • Debora Griffin • Dalhousie University • Tom Duck • Jim Drummond • Jeff Pierce • Randall Martin • Mark Gibson • Matt Seaboyer • Jonathan Franklin • Jason Hopper • Kimiko Sakamoto • Kaja Rotermund • Loren Bailey • Environment Canada • Lisa Langley • David Tarasick • Jane Liu • Steve Beauchamp • Richard Leaitch • Chris Fogarty • David Waugh • Doug Steeves • Lucy Chisholm • Naval Research Laboratory • Mike Fromm • Edward Hyer • B.J. Stocks Wildfire Investigations Ltd. • Brian Stocks • NASA GMAO • Steven Pawson • University of Sherbrooke • Norm O’Neill
Overview of summer 2010 boreal fire activity • Observed fire hotspots for season up to 31 August show large concentration in northern SK, extending into NWT. • Fires also concentrated in QC (earlier in fire season) and BC. • Aggregated MODIS fire counts for boreal North America (top) and Eurasia (bottom), for 1 July to 31 August. • Fire counts do not exceed 10,000 but generally greater than 100 in northern SK, BC, and eastern Siberia.
Canadian fire activity: summer 2010 vs. 10 year average http://www.ciffc.ca/ • Burnt area through BORTAS-A considerably higher than 10 year average. • Number of fires slightly less apart from 3 week period between 17 July and 7 August. • Slightly higher number of fires SK and QC but almost 10-fold increase in burnt area in SK. http://fire.cfs.nrcan.gc.ca/firereport/report-rapport-eng.php
Satellite measurements are integral to BORTAS (Links to NCEO activities) They will be (mainly) used to: • Identify and characterize biomass burning source regions (via emission inventories, e.g. GFED, FLAMBE, FINNv1) • Help identify and estimate pyroconvection(?) • Analyse characteristic ratios of chemical tracers (flaming vs smouldering emissions) as they evolve from the point of emission to where we can measure them with the BAe146 and beyond • Test consistency with ground-based and airborne measurements • Evaluate model chemistry and physical processes
Data assimilation plans for BORTAS • 4D-Var assimilation of BORTAS aircraft measurements • use GEOS-Chem adjoint to evaluate model plume chemistry and evolution over the North Atlantic Ocean • Assimilation of satellite data (TES and MetOp products) • constrain model tracer distributions to isolate and evaluate uncertainties associated with emissions • consistent comparison of aircraft and satellite products
TES observing modes for BORTAS Global survey daytime observation locations, July 2008 Step and stare daytime observation locations, July 2008 • Global survey observations: • standard operating mode, observations spaced ~2° (180 km) along orbit track. • Special observations: • Step and stare: observations spaced ~0.4° (45 km) along orbit track over latitude range of 50°. • Stare: 32 observations taken over a single location on the closest orbit track (i.e. Halifax, NS). • Potential for retrieving species related to biomass burning (e.g. methanol, ammonia, formic acid, HCN, PAN)
Plots show sensitivity of ozone in the free troposphere over Maritime Canada to NOx emission sources during July 2011. Sensitivity to biomass burning emissions distinct from lightning and anthropogenic emissions. GEOS-Chem adjoint Biomass Burning Lightning Anthropogenic Aircraft/biofuel/soil • Satellite data assimilation to evaluate model initial conditions and inputs (emissions sources). • Assimilate aircraft measurements to evaluate impact on downwind chemistry of biomass burning outflow. • Scale up aircraft measurements to compare against satellite observations.
Optimizing biomass burning emissions MOPITT CO columns, 31 July 2010 Raw GEOS-Chem CO columns • Global 4D-Var inversion of GEOS-Chem CO model using MOPITT version 4 CO columns. • Scaling factors show that CO emissions from all sources are too high across the northern hemisphere (too low in extra-tropical southern hemisphere). Parrington et al., ACP, 2012 Analysed GEOS-Chem CO columns Scaling factors for CO emissions, July 2010 [molec/cm2]
O3 bias relative to ozonesondes No TES assim. TES assim. Pressure / hPa % difference Parrington, et al., JGR, 2008 Constraining the tropospheric ozone distribution Sequential Sub-optimal Kalman filter Kalman Gain Matrix: Analysis Error Cov. Matrix: • Observation operator (H) accounts for TES averaging kernels and a priori profiles • Analysis error variance transported as a passive tracer • Satellite data assimilation to evaluate model initial conditions and inputs (emissions sources). • Assimilate aircraft measurements to evaluate impact on downwind chemistry of biomass burning outflow. • Scale up aircraft measurements to compare against satellite observations.