Download
1 / 57
590 likes | 742 Views
Business Statistics. Chapter 3 Describing Data Using Numerical Measures. Chapter Goals. After completing this chapter, you should be able to: Compute and interpret the mean, median, and mode for a set of data

E N D
Business Statistics Chapter 3Describing Data Using Numerical Measures Tran Van Hoang - hoangtv@ftu.edu.vn - Business Statistics
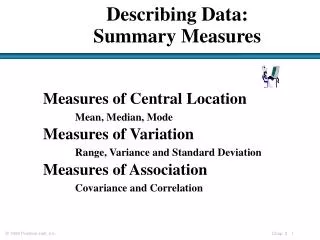
Chapter Goals After completing this chapter, you should be able to: • Compute and interpret the mean, median, and mode for a set of data • Compute the range, variance, and standard deviation and know what these values mean • Construct and interpret a box and whiskers plot • Compute and explain the coefficient of variation and z scores • Use numerical measures along with graphs, charts, and tables to describe data Tran Van Hoang - hoangtv@ftu.edu.vn - Business Statistics
Chapter Topics • Measures of Center and Location • Mean, median, mode, geometric mean, midrange, weighted mean • Other measures of Location • percentiles, quartiles • Measures of Variation • Range, interquartile range, variance and standard deviation, coefficient of variation Tran Van Hoang - hoangtv@ftu.edu.vn - Business Statistics
Summary Measures Describing Data Numerically Center and Location Other Measures of Location Variation Mean Range Percentiles Median Interquartile Range Quartiles Mode Variance Weighted Mean Standard Deviation Coefficient of Variation Tran Van Hoang - hoangtv@ftu.edu.vn - Business Statistics
Measures of Center and Location Overview Center and Location Mode Weighted Mean Mean Median Tran Van Hoang - hoangtv@ftu.edu.vn - Business Statistics
Mean (Arithmetic Average) • The Mean is the arithmetic average of data values • Sample mean • Population mean n = Sample Size N = Population Size Tran Van Hoang - hoangtv@ftu.edu.vn - Business Statistics
Mean (Arithmetic Average) (continued) • The most common measure of central tendency • Mean = sum of values divided by the number of values • Affected by extreme values (outliers) 0 1 2 3 4 5 6 7 8 9 10 0 1 2 3 4 5 6 7 8 9 10 Mean = 3 Mean = 4 Tran Van Hoang - hoangtv@ftu.edu.vn - Business Statistics
Median • Not affected by extreme values • In an ordered array, the median is the “middle” number • If n or N is odd, the median is the middle number • If n or N is even, the median is the average of the two middle numbers 0 1 2 3 4 5 6 7 8 9 10 0 1 2 3 4 5 6 7 8 9 10 Median = 3 Median = 3 Tran Van Hoang - hoangtv@ftu.edu.vn - Business Statistics
Mode • A measure of central tendency • Value that occurs most often • Not affected by extreme values • Used for either numerical or categorical data • There may may be no mode • There may be several modes 0 1 2 3 4 5 6 0 1 2 3 4 5 6 7 8 9 10 11 12 13 14 Mode = 5 No Mode Tran Van Hoang - hoangtv@ftu.edu.vn - Business Statistics
Weighted Mean • Used when values are grouped by frequency or relative importance Example: Sample of 26 Repair Projects Weighted Mean Days to Complete: Tran Van Hoang - hoangtv@ftu.edu.vn - Business Statistics
Five houses on a hill by the beach Review Example House Prices: $2,000,000 500,000 300,000 100,000 100,000 Tran Van Hoang - hoangtv@ftu.edu.vn - Business Statistics
Mean: ($3,000,000/5) = $600,000 Median: middle value of ranked data = $300,000 Mode: most frequent value = $100,000 Summary Statistics House Prices: $2,000,000 500,000 300,000 100,000 100,000 Sum 3,000,000 Tran Van Hoang - hoangtv@ftu.edu.vn - Business Statistics
Meanis generally used, unless extreme values (outliers) exist Then medianis often used, since the median is not sensitive to extreme values. Example: Median home prices may be reported for a region – less sensitive to outliers Which measure of location is the “best”? Tran Van Hoang - hoangtv@ftu.edu.vn - Business Statistics
Shape of a Distribution • Describes how data is distributed • Symmetric or skewed Right-Skewed Symmetric Left-Skewed Mean = Median=Mode Mode<Median <Mean Mean < Median <Mode (Longer tail extends to left) (Longer tail extends to right) Tran Van Hoang - hoangtv@ftu.edu.vn - Business Statistics
Other Location Measures The pth percentile in a data array: • p% are less than or equal to this value • (100 – p)% are greater than or equal to this value (where 0 ≤ p ≤ 100) Other Measures of Location Percentiles Quartiles • 1st quartile = 25th percentile • 2nd quartile = 50th percentile = median • 3rd quartile = 75th percentile Tran Van Hoang - hoangtv@ftu.edu.vn - Business Statistics
Percentiles • The pth percentile in an ordered array of n values is the value in ith position, where • Example: The 60th percentile in an ordered array of 19 values is the value in 12th position: Tran Van Hoang - hoangtv@ftu.edu.vn - Business Statistics
Quartiles • Quartiles split the ranked data into 4 equal groups 25% 25% 25% 25% Q1 Q2 Q3 • Example: Find the first quartile Sample Data in Ordered Array: 11 12 13 16 16 17 18 21 22 (n = 9) Q1 = 25th percentile, so find the (9+1) = 2.5 position so use the value half way between the 2nd and 3rd values, so Q1 = 12.5 25 100 Tran Van Hoang - hoangtv@ftu.edu.vn - Business Statistics
Box and Whisker Plot • A Graphical display of data using 5-number summary: Minimum -- Q1 -- Median -- Q3 -- Maximum Example: 25% 25% 25% 25% Tran Van Hoang - hoangtv@ftu.edu.vn - Business Statistics
Shape of Box and Whisker Plots • The Box and central line are centered between the endpoints if data is symmetric around the median • A Box and Whisker plot can be shown in either vertical or horizontal format Tran Van Hoang - hoangtv@ftu.edu.vn - Business Statistics
Distribution Shape and Box and Whisker Plot Left-Skewed Symmetric Right-Skewed Q1 Q2 Q3 Q1 Q2 Q3 Q1 Q2 Q3 Tran Van Hoang - hoangtv@ftu.edu.vn - Business Statistics
Box-and-Whisker Plot Example • Below is a Box-and-Whisker plot for the following data: 0 2 2 2 3 3 4 5 5 10 27 • This data is very right skewed, as the plot depicts Min Q1 Q2 Q3 Max 0 2 3 5 27 Tran Van Hoang - hoangtv@ftu.edu.vn - Business Statistics
Measures of Variation Variation Range Variance Standard Deviation Coefficient of Variation Population Standard Deviation Interquartile Range Population Variance Sample Variance Sample Standard Deviation Tran Van Hoang - hoangtv@ftu.edu.vn - Business Statistics
Measures of variation give information on the spread or variability of the data values. Variation Same center, different variation Tran Van Hoang - hoangtv@ftu.edu.vn - Business Statistics
Range • Simplest measure of variation • Difference between the largest and the smallest observations: Range = xmaximum – xminimum Example: 0 1 2 3 4 5 6 7 8 9 10 11 12 13 14 Range = 14 - 1 = 13 Tran Van Hoang - hoangtv@ftu.edu.vn - Business Statistics
Disadvantages of the Range • Ignores the way in which data are distributed • Sensitive to outliers 7 8 9 10 11 12 7 8 9 10 11 12 Range = 12 - 7 = 5 Range = 12 - 7 = 5 1,1,1,1,1,1,1,1,1,1,1,2,2,2,2,2,2,2,2,3,3,3,3,4,5 Range = 5 - 1 = 4 1,1,1,1,1,1,1,1,1,1,1,2,2,2,2,2,2,2,2,3,3,3,3,4,120 Range = 120 - 1 = 119 Tran Van Hoang - hoangtv@ftu.edu.vn - Business Statistics
Interquartile Range • Can eliminate some outlier problems by using the interquartile range • Eliminate some high-and low-valued observations and calculate the range from the remaining values. • Interquartile range = 3rd quartile – 1st quartile Tran Van Hoang - hoangtv@ftu.edu.vn - Business Statistics
Interquartile Range Example: Median (Q2) X X Q1 Q3 maximum minimum 25% 25% 25% 25% 12 30 45 57 70 Interquartile range = 57 – 30 = 27 Tran Van Hoang - hoangtv@ftu.edu.vn - Business Statistics
Variance • Average of squared deviations of values from the mean • Samplevariance: • Populationvariance: Tran Van Hoang - hoangtv@ftu.edu.vn - Business Statistics
Standard Deviation • Most commonly used measure of variation • Shows variation about the mean • Has the same units as the original data • Samplestandard deviation: • Populationstandard deviation: Tran Van Hoang - hoangtv@ftu.edu.vn - Business Statistics
Calculation Example:Sample Standard Deviation Sample Data (Xi) : 10 12 14 15 17 18 18 24 n = 8 Mean = x = 16 Tran Van Hoang - hoangtv@ftu.edu.vn - Business Statistics
Comparing Standard Deviations Data A Mean = 15.5 s = 3.338 11 12 13 14 15 16 17 18 19 20 21 Data B Mean = 15.5 s = .9258 11 12 13 14 15 16 17 18 19 20 21 Data C Mean = 15.5 s = 4.57 11 12 13 14 15 16 17 18 19 20 21 Tran Van Hoang - hoangtv@ftu.edu.vn - Business Statistics
Coefficient of Variation • Measures relative variation • Always in percentage (%) • Shows variation relative to mean • Is used to compare two or more sets of data measured in different units PopulationSample Tran Van Hoang - hoangtv@ftu.edu.vn - Business Statistics
Comparing Coefficient of Variation • Stock A: • Average price last year = $50 • Standard deviation = $5 • Stock B: • Average price last year = $100 • Standard deviation = $5 Both stocks have the same standard deviation, but stock B is less variable relative to its price Tran Van Hoang - hoangtv@ftu.edu.vn - Business Statistics
The Empirical Rule • If the data distribution is bell-shaped, then the interval: • contains about 68% of the values in the population or the sample 68% Tran Van Hoang - hoangtv@ftu.edu.vn - Business Statistics
The Empirical Rule • contains about 95% of the values in the population or the sample • contains about 99.7% of the values in the population or the sample 95% 99.7% Tran Van Hoang - hoangtv@ftu.edu.vn - Business Statistics
Tchebysheff’s Theorem • Regardless of how the data are distributed, at least (1 - 1/k2) of the values will fall within k standard deviations of the mean • Examples: (1 - 1/12) = 0%……..... k=1 (μ± 1σ) (1 - 1/22) = 75% …........ k=2 (μ± 2σ) (1 - 1/32) = 89% ………. k=3 (μ± 3σ) At least within Tran Van Hoang - hoangtv@ftu.edu.vn - Business Statistics
Standardized Data Values • A standardized data value refers to the number of standard deviations a value is from the mean • Standardized data values are sometimes referred to as z-scores Tran Van Hoang - hoangtv@ftu.edu.vn - Business Statistics
Standardized Population Values where: • x = original data value • μ = population mean • σ = population standard deviation • z = standard score (number of standard deviations x is from μ) Tran Van Hoang - hoangtv@ftu.edu.vn - Business Statistics
Standardized Sample Values where: • x = original data value • x = sample mean • s = sample standard deviation • z = standard score (number of standard deviations x is from μ) Tran Van Hoang - hoangtv@ftu.edu.vn - Business Statistics
Using Microsoft Excel • Descriptive Statistics are easy to obtain from Microsoft Excel • Use menu choice:tools / data analysis / descriptive statistics • Enter details in dialog box Tran Van Hoang - hoangtv@ftu.edu.vn - Business Statistics
Using Excel • Use menu choice:tools / data analysis / descriptive statistics Tran Van Hoang - hoangtv@ftu.edu.vn - Business Statistics
Using Excel (continued) • Enter dialog box details • Check box for summary statistics • Click OK Tran Van Hoang - hoangtv@ftu.edu.vn - Business Statistics
Excel output Microsoft Excel descriptive statistics output, using the house price data: House Prices: $2,000,000 500,000 300,000 100,000 100,000 Tran Van Hoang - hoangtv@ftu.edu.vn - Business Statistics
Chapter Summary • Described measures of center and location • Mean, median, mode, geometric mean, midrange • Discussed percentiles and quartiles • Described measure of variation • Range, interquartile range, variance, standard deviation, coefficient of variation • Created Box and Whisker Plots Tran Van Hoang - hoangtv@ftu.edu.vn - Business Statistics
Chapter Summary (continued) • Illustrated distribution shapes • Symmetric, skewed • Discussed Tchebysheff’s Theorem • Calculated standardized data values Tran Van Hoang - hoangtv@ftu.edu.vn - Business Statistics
Exercises 3.1.The number of cars… 6 3 9 6 6 5 4 1 Compute the mean, median, and mode for these sample data 3.5. The number of hot dogs… Compute the mean, median, mode, first quartile and third quartile for these sample data Tran Van Hoang - hoangtv@ftu.edu.vn - Business Statistics
Exercises 3.6. Five wheat farms… 1. Compute the mean yield for this sample of five farms 2. Taking into account the number of acres on each farm, computer a weighted mean for this sample Tran Van Hoang - hoangtv@ftu.edu.vn - Business Statistics
Exercises 3.7. The following frequency distribution is given for the ages of students at a small private university • Compute the mean age at this university (use the midpoint of each age class to represent all values) • What is the median age this university Tran Van Hoang - hoangtv@ftu.edu.vn - Business Statistics
Exercises 3.20. Assume the following data set represents the population: Determine the range, variance, and standard deviation for the set data Tran Van Hoang - hoangtv@ftu.edu.vn - Business Statistics