Download
1 / 19
190 likes | 466 Views
SIGNIFICANT FIGURES. ACCURACY VS. PRECISION. In labs, we are concerned by how “correct” our measurements are They can be accurate and precise Accurate: How close a measured value is to the actual measurement Precise: How close a series of measurements are to each other. EXAMPLE.

E N D
ACCURACY VS. PRECISION • In labs, we are concerned by how “correct” our measurements are • They can be accurate and precise • Accurate: How close a measured value is to the actual measurement • Precise: How close a series of measurements are to each other
EXAMPLE • The true value of a measurement is 23.255 mL • Below are a 2 sets of data. Which one is precise and which is accurate? • 23.300, 23.275, 23.235 • 22.986, 22.987, 22.987
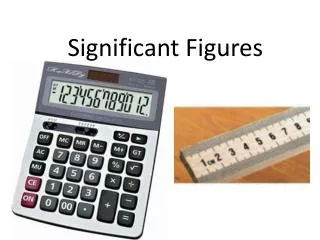
SCIENTIFIC INSTRUMENTS • In lab, we want our measurements to be as precise and accurate as possible • For precision, we make sure we calibrate equipment and take careful measurements • For accuracy, we need a way to determine how close our instrument can get to the actual value
SIGNFICANT FIGURES • We need significant figures to tell us how accurate our measurements are • The more accurate, the closer to the actual value • Look at this data. Which is more accurate? Why? • 25 cm • 25.2 cm • 25.22 cm
ANSWER • 25.22cm • The more numbers past the decimal (the more significant figures), the closer you get to the true value. • How do we determine how many significant figures are in different pieces of lab equipment?
SIGNIFICANT FIGURES • Significant figure – any digit in a measurement that is known for sure plus one final digit, which is an estimate • Example: • 4.12 cm • This number has 3 significant figures • The 4 and 1 are known for certain • The 2 is an estimate
SIGNIFICANT FIGURES • In general: the more significant figures you have, the more accurate the measurement • Determining significant figures with instrumentation • Find the mark for the known measurements • Estimate the last number between marks
SIGNIFICANT FIGURES • Try these: • Graduated cylinder • Triple Beam balance • Ruler
RULES FOR SIGNIFICANT FIGURES • Rule 1: Nonzero digits are always significant • Rule 2: Zeros between nonzero digits are significant • 40.7 (3 sig figs.) • 87009 (5 sig figs.) • Rule 3: Zeros in front of nonzero digits are not significant • 0.009587 (4 sig figs.) • 0.0009 (1 sig figs.)
RULES FOR SIGNIFICANT FIGURES • Rule 4: Zeros at the end of a number and to the right of the decimal point are significant • 85.00 (4 sig figs.) • 9.070000000 (10 sig figs.) • Rule 5: Zeros at the end of a number are not significant if there is no decimal • 40,000,000 (1 sig fig)
RULES FOR SIGNIFICANT FIGURES • Rule 6: When looking at numbers in scientific notation, only look at the number part (not the exponent part) • 3.33 x 10⁻⁵ (3 sig fig) • 4 x 10⁸ (1 sig fig) • Rule 7: When converting from one unit to the next keep the same number of sig. figs. • 3.5 km (2 sig figs.) = 3.5 x 10³ m (2 sig figs.)
HOW MANY SIGNIFICANT FIGURES? • 35.02 • 0.0900 • 20.00 • 3.02 X 10⁴ • 4000
ANSWERS • 4 • 3 • 4 • 3 • 1
ROUNDING TO THE CORRECT NUMBER OF SIG FIGS. • Many times, you need to put a number into the correct number of sig figs. • This means you will have to round the number • EXAMPLE: • You start with 998,567,000 • Give this number in 3 sig figs.
ANSWER • Step 1: Get the first 3 numbers (3 sig figs.) • 998 • Step 2: Check to see if you have to round up or keep the number the same • You need to look at the 4th number • 9985 • If the next number is 5 or higher, round up • If the next number is 4 or less, stays the same • Therefore = 999
ANSWER • Step 3: Take your numbers and put the decimal after the first digit • 9.99 • Step 4: Count the number of places you have to move to get to the end of the number and put it in scientific notation. • 9.99 x 10⁸ • NOTE: If the number is BIG it will be a positive exponent. If the number is a DECIMAL, it will be a negative exponent.
OTHER POSSIBILITY • Example: • 999,999,999 (3 sig. figs.) • When you take the first three numbers, you get • 999 • But when you round, it is going to round from 999 1000 • Therefore, the number becomes: • 1.00 x 10⁸
TRY THESE • 10,000 (3 sig. figs.) • 0.00003231 (2 sig. figs.) • 347,504,221 (3 sig. figs.) • 0.000003 (2 sig. figs.) • 89,165,987 (3 sig. figs.)