Download
1 / 74
740 likes | 838 Views
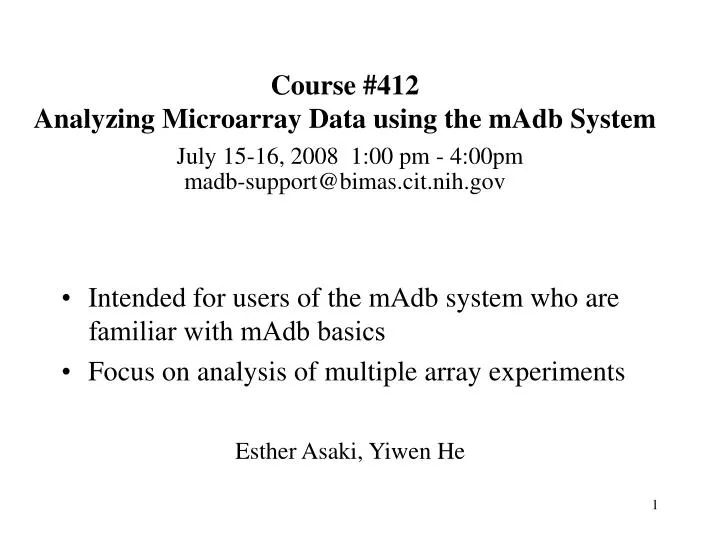
Course #412 Analyzing Microarray Data using the mAdb System July 15-16, 2008 1:00 pm - 4:00pm madb-support@bimas.cit.nih.gov. Intended for users of the mAdb system who are familiar with mAdb basics Focus on analysis of multiple array experiments. Esther Asaki, Yiwen He. Agenda.

E N D
Course #412Analyzing Microarray Data using the mAdb SystemJuly 15-16,2008 1:00 pm - 4:00pmmadb-support@bimas.cit.nih.gov • Intended for users of the mAdb system who arefamiliar with mAdb basics • Focus on analysis of multiple array experiments Esther Asaki, Yiwen He
Agenda • mAdb system overview • mAdb dataset overview • mAdb analysis tools for dataset • Class Discovery - clustering, PCA, MDS • Class Comparison - statistical analysis • t-test • ANOVA • Significance Analysis of Microarrays - SAM • Class Prediction - PAM Various Hands-on exercises
Project Summary • Summary Statistics • Array images • Graphical Report • Dataset Extraction • Normalization • Spot Filtering • Analysis Tools • Class Discovery • Class Comparison • Class Prediction • Annotation Tools • Feature Report • Gene Ontology • BioCarta Pathway • KEGG Pathway mAdb Data Workflow Upload Data Quality Control Prepare Dataset Analysis/Model Review Annotation • File Format • GenePix • MAS5 • GCOS 1.1 • ArraySuite • Agilent FE
What is a dataset? • mAdb Dataset • Collection of data from multiple experiments • Genes as rows and experiments as columns sample1 sample2 sample3 sample4 sample5 … 1 0.46 0.30 0.80 1.51 0.90 ... 2 -0.10 0.49 0.24 0.06 0.46 ... 3 0.15 0.74 0.04 0.10 0.20 ... 4 -0.45 -1.03 -0.79 -0.56 -0.32 ... 5 -0.06 1.06 1.35 1.09 -1.09 ... Genes Gene expression level = (normalized) Log(Red signal / Green signal)
New or Existing Dataset: • Create New Dataset 2. Access Existing Dataset
Dataset History • Analysis Tools • Retrieval and Display Options… Dataset Display Page
Newly created dataset puts all experiments into a single group Dataset Display • Dataset display options dynamic • Integrated gene information
mAdb Dataset Display Group label Sample name genes
Group Examples • Technical/Biological replicates • Knock-outs and wild types • Cancer vs normal samples • Time course points • Dosage levels
Dataset Group Assignment • Array Order Designation/Filtering • Array Group Assignment/Filtering • Filter/Group by Array Properties
Array Order Designation/Filtering • Order arrays in dataset • Delete/Add back arrays in dataset • Subsequent analysis will be ordered by groups first and then ordered within each group • Does not group arrays
Array Group Assignment/Filtering • One click per array for additional group • Not convenient for large dataset • Can not order within group
Filter/Group by Array Properties • Array properties include Name and Short Description • Identify consistent pattern
Filter/Group by Array Properties • Convenient for large dataset • Can not order arrays within group
Group Assignment • Group assignment information is carried into relevant analysis • Dataset is independent from microarray platforms
Examples for using groups • Additional Filtering per Group • Correlation summary report • Average arrays within groups • Calculate statistics within groups
Filter by Group Properties Ensures each group has sufficient number of non-missing values
Correlation Summary Report • Pair wise correlation between 2 samples in dataset • Individual scatter plot available • Group pattern for quality control
Average Arrays within Groups • Averages calculated using log ratios regardless of linear or log display options chosen
Calculate statistics within Groups • All values calculated using log ratios regardless of linear or log display options chosen
Dataset ISmall Round Blue Cell Tumors (SRBCTs) • Khan et al. Nature Medicine 2001 • 4 tumor classifications • 63 training samples, 25 testing samples, 2308 genes • Neural network approach
Hands-on Session 1 • Lab 1- Lab 4 • Read the questions before starting, then answer them in the lab. • Use web site: http://madb-training.cit.nih.gov • Avoid maximizing web browser to full screen. • Total time: 20 minutes
3. mAdb dataset analysis tools • Class Discovery: clustering, PCA, MDS • Class Comparison: statistical analysis • Class Prediction: PAM
Class Discovery Example • Discover cancer subtypes by gene expression profiles • Identify genes which have different expression patterns in different groups • Tools: Cluster Analysis, PCA and MDS
Class Comparisons Example • Find genes that are differentially expressed among cancer groups • Find genes up/down regulated by drug treatment • Tools: • Group comparison • Statistics Results filtering
Class Prediction Example • Identify an expression profile which correlates with survival in certain cancers • Identify an expression profile which can be used to diagnose different types of lymphomas • Tools: Prediction Analysis for Microarrays (PAM)
3. mAdb dataset analysis tools • Class Discovery: clustering, PCA, MDS • Class Comparison: statistical analysis • Class Prediction: PAM
Class Discovery • Dataset with large amount of data • Dataset not organized • Visualization with Clustering, PCA, MDS
Cluster Analysis • Organize large microarray dataset into meaningful structures • Visualize and extract expression patterns
What to Cluster? Genes - identify groups of genes that have correlated expression profiles Samples - put samples into groups with similar overall gene expression profiles
Clustering Methods • Hierarchical clustering • Partitional clustering • K-means • Self-Organizing Maps (SOM)
Cluster Example on Genes Much easier to look at large blocks of similarly expressed genes Dendogram helps show how ‘closely related’ expression patterns are Clustering A. Cholesterol syn. B. Cell cycle C. Immediate-early response D. Signaling E. Tissue remodeling
2 Steps • Pick a distance method • Correlation • Euclidian • Pick the linkage method • Average linkage • Complete linkage • Single linkage
Correlation • Compares shape of expression curves (-1 to 1) • Can detect inverse relationships (absolute correlation)
Two Flavors of correlation • Correlation (centered-classical Pearson) • Correlation ( un-centered) • assume the mean of the data is 0, penalize if not • Measures both similarity of shape and the offset from 0
shape Shape and offset distance Similarity/Distance Metric Summary
2 clusters? 3 clusters? 4 clusters? Tree Cutting Degrees of dissimilarity
Hierarchical Clustering Summary • Detection of patterns for both genes and samples • Good visualization with tree graphs • Dataset size limitations • No partition in results, require tree cutting
Partitional clustering : K-means • Partition data into K clusters, with number K supplied by user. • Produce cluster membership as results.
K-means Algorithm • Divide observations into K clusters. • Use cluster averages (means) to represent clusters • Maximize the inter-cluster distance Minimize intra-cluster distance.
X4 X1 X3 X21 X16 X7 X5 X2 X8 X12 X17 X6 X11 X14 X9 X15 X13 X10 X19 X20 X18 K-means Algorithm k1 k2 k4 k3
K-means Algorithm X4 X1 X3 X21 X16 k1 X7 X5 X2 k2 X8 X12 X17 X6 X11 X14 X9 k4 X15 X13 X10 X19 k3 X20 X18
K-means Algorithm X4 X1 X3 X21 X16 k1 X7 X5 X2 k2 X8 X12 X17 X6 X11 X14 X9 k4 X15 X13 X10 X19 k3 X20 X18