Download
1 / 25
250 likes | 379 Views
Hidden Markov Models. As used to summarize multiple sequence alignments, and score new sequences. Time flies like an arrow, but fruit flies like a banana. The Markov Property : the state of a system depends only on its previous state.

E N D
Hidden Markov Models As used to summarize multiple sequence alignments, and score new sequences
Time flies like an arrow, but fruit flies like a banana • The Markov Property: the state of a system depends only on its previous state. • Works very well for speech recognition: a sound is modified by the sound immediately preceding it. • For DNA and protein sequences, there is no reason to think that the subunit just upstream is the only influence: probably the whole neighborhood is important. • So, HMMs are just an approximation, but they work very well. • In a first order Markov model, the current event only depends on the immediately preceding event. Second order models use the two preceding events, third order models use the three preceding, etc. • as far as I know, all the HMMs for protein sequences that are readily available are first order models.
Hidden Markov Models • Position-specific substitution matrices have an important weakness: they don’t deal very well with gaps caused by small insertions and deletions. • A we know, gaps are part of most sequence alignments. • The standard solution these days: profile hidden Markov models (HMM). • Like PSSM, they are a statistical model of a multiple sequence alignment, but they easily incorporate gaps. • HMMs can be used to evaluate a query sequence: to determine how likely the query is to fit the model.
Hidden Markov Models • The basic problem is: given a series of observations, determine the most probable set of hidden states that generate them. • For matching a query sequence to a model, each residue in the query is assigned one of 3 states: it is a match/mismatch to a residue in the model, or it is deleted, or it is inserted • but, to understand HMMs, we need a simpler and more concrete example, taken from Wikipedia, which we can call Life in St. Paul. • I have a friend (Carol) in St. Paul who has only 3 interests in life: going for a walk, shopping, and cleaning her apartment. • St. Paul weather can be either sunny or rainy. Carol decides which of her 3 activities she will do based on the weather. • Every day she e-mails me to tell me what she is doing. (exciting!) • From the sequence of her activities, I infer the most likely weather for each day.
Terminology • The HMM for Life in St. Paul has 2 states: rainy and sunny. • These states are hidden: we don’t know them and can only infer them from Carol’s behavior. • For each set, there is a set of transition probabilities: what will happen the next day. • Which depends only on what happened today (the Markov property) • prob R -> R (stays rainy) = 0.7 • prob R -> S (goes from rain to sun) = 0.3 • prob S-> S (stays sunny) = 0.6 • prob S -> R (goes from sun to rain) = 0.4 • For each state, there is a set of emission probabilities: what Carol’s behavior will be under different weather conditions. • These behaviors are our observations: she tells us what she is doing each day. • if state is Rainy: • walk = 0.1 • clean = 0.5 • shop = 0.4 • if state is Sunny: • walk = 0.6 • clean = 0.1 • shop = 0.3 • A path is a sequence of states through the model: what the state is for each day. We are trying to determine the optimal (most likely) path that fits our observations.
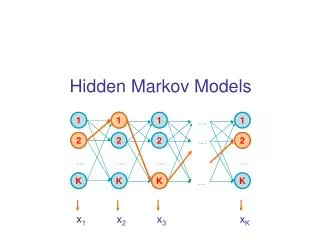
State Diagrams • One way to draw state diagram is to have arrows going back and forth between states. Note that there is also a transition back to the same state. • This represents eternity: each day is in one of the other state.
State Diagrams • Another way is to move forward in time, with a new pair of Rainy and Sunny • states for each new day. I like this because it is a closer approximation to • progressing through a sequence, trying to get a match between the query • sequence and the model.
Basic Questions • We are interested in 3 basic questions: • Given the model and its parameters (the transition and emission probabilities), what is the most likely path that explains our observations? • This is done using the Viterbi algorithm. • What is the overall probability that the model fits our observations? • This is the most common use of HMMs in bioinformatics: determining the probability that the query sequence fits the model • Uses the forward algorithm, which is very similar to Viterbi • Given a set of observations, how can we accurately estimate parameters for the model? • This uses the Baum-Welch algorithm.
Viterbi Algorithm • Used to determine most probable path (series of states) given a set of observed data. • the forward algorithm is closely related and can be performed at the same time: it generates the overall probability of the observed sequence. • based on the idea that if you always take the most likely next step, you will get the most likely overall path. Given a first order model, this seems quite reasonable. • Very similar to dynamic programming • Go through the observations from beginning to end, inferring a state of the hidden machine for each observation. • Keep track of 3 values: overall probability (prob), Viterbi path (v_path), and Viterbi probability (v_prob) (i.e. the probability of the observations given the Viterbi path). • Test all possible next steps. The probability of a possible step given its corresponding observation is the probability of the transition to that next state times the emission probability of the observation in that state. • for overall probability prob, multiply each new prob by the old prob, then add together (i.e. overall probability is sum of all possible next steps) • for Viterbi prob, just take the highest next-step probability and multiply it by the previous v_prob • for Viterbi path, add next state to list of previous states
Our Example • observations: WCSW • start at beginning. We will simply assume that the day before the beginning was sunny Observation is W (walk), so go with the most probable. • P(Walk | Sunny) = 0.6; P(Walk | Rainy) = 0.1 • prob (overall probability) = 0.6 • v_prob (Viterbi probability) = 0.6 • v_path = S • Step 2 (next day) observation is C (clean) • Given that previous day was sunny: • stays sunny. Transition prob = 0.6. Prob of cleaning on a sunny day (emission prob) = 0.1. Total probability for this possibility (i.e. it stays sunny) = 0.6 x 0.1 = 0.06. • turns rainy. Transition prob = 0.4. Prob of cleaning on a rainy day = 0.5. Total prob for this step = 0.4 x 0.5 = 0.20. Therefore this is the most likely state of step 2 • update overall probability: prob = 0.6 x 0.06 + 0.6 x 0.2 = 0.152 • update Viterbi probabilty: v_prob = 0.6 x 0.2 = 0.12 • update Viterbi path: v_path = SR
More • step 3. Obs = S (shop) • given previous day was Rainy: • stays rainy = 0.7. Prob of shopping on a rainy day = 0.4. Prob for this step = 0.7 x 0.4 = 0.28 • turns sunny = 0.3. Prob of shopping on a sunny day = 0.3. Total = 0.3 x 0.3 = 0.09 • best is R. v_path now is SRR • overall prob = previous prob (0.152) x sum of this step’s possibilities: 0.152 x (0.28 + 0.09) = 0.0562 • v_prob = previous v_prob x best current prob = 0.12 x 0.28 = 0.0336.
Still More • Step 4 (last). Obs = W • previous day was R: • R-> R transition prob = 0.7. Emission probability of a walk on a rainy day is 0.1. Total for this step = 0.7 x 0.1 = 0.07. • R -> S prob = 0.3. Emission prob = 0.6. Total = 0.3 x 0.6 = 0.18. • Best is S (turns sunny). v_path = SRRS • overall prob = previous (0.0562) x sum of current possibilities (0.07 + 0.18 = 0.25) = 0.562 x 0.25 = 0.0141. • v_prob = previous (0.0336) x best (0.18) = 0.00605. • We have now determined the best set of states that would give us the observed data (v_path = SRRS), and the overall probability of the observed data (given the model) (prob = 0.0141). • It is obvious that multiplying probabilities soon gets to very small numbers, so in general they are converted to logarithms and added.
Results from a Longer Run activity: CCSCCCSCWCWSCSCSSSCSSSWWWWSCCSSWCCSWWSCWSCSSCSSSWW weather: RRRRRRSSSRSSRSRSRRRRRRSSSSSSRRRSRRRSSSRSSRRRSSRRSS predicted: RRRRRRRRSRSSRRRRRRRRRRSSSSSRRRRSRRRSSSRSSRRRRRRRSS • Viterbi prob = 5.48e-30 • Overall prob = 1.92e-24 • Percent correct = 86.0 %
Estimating Model Parameters • The parameters that need to be estimated are the transition and emission probabilities. Since they must sum to 1, our St. Paul weather HMM needs only 2 transition probabilities and 2 emission probabilities estimated. • Sequence models have very large numbers of parameters to estimate, which requires large amounts of data. • If you have training data with known states (e.g. you know when it is sunny or rainy, plus your friend’s activities, for a period of time: parameters come from simply calculating the proportion of each transition or emission. • Example: on rainy days, Carol took 6 walks, cleaned 30 times, and shopped 24 times. Emission probability estimates are 6/60 = 0.1, 30/60 =0.5, 24/60 = 0.4. (very frequentist!) • problem of 0 counts. Add a “pseudocount” so this probabilty isn’t zero (because it might actually happen). Typically add 1 to numerator and total number of possibilites to denominator. • e.g. for walks, emission prob = (6 +1) / (60 + 3) = 7/63 = 0.111
More Parameter Estimation • If you don’t know the underlying states: you just have a series of observations: you can use the Baum-Welch algorithm to estimate parameters. • Need the backward algorithm in addition to the forward algorithm. The backward algorithm works exactly the same as the forward algorithm, except that you calculate from the end to the beginning. • The Baum-Welch algorithm starts with a set of parameters that have been estimated or guessed. • Then feed each training sequence through the model, with overall probabilities calculated both forward and backward. • Then use these probabilities to weight the contribution of each sequence to the transition and emission probabiliites. • Then use this to adjust the parameters.
Profile HMMs • Start with a multiple sequence alignment: we want to make a statistical model of it.
Building the Model: Match States • If we were just trying to do an ungapped alignment, we could use a very simple, unbranched HMM, where every match state can only transition to another match state • Each match state has an emission probability for each amino acid, with different emission probabilities for every match state • This is essentially what a PSSM is: the scores in each column of a PSSM could be scaled to 0-1, giving emission probabilities. • The transition probabilities are all 1: the only choice is to move to the next match state.
Insertion States • In a multiple alignment, there are often columns which are gaps in most sequences but have amino acids in a few sequences. • These columns are best dealt with as insertion states. • As you move through the model, emitting the query sequence, insertion states emit the extra amino acids found in these columns. • Insertion states have emission probabilities that are usually the same as the overall proportion of each amino acid in the database. • Insertion states loop back on themselves, meaning that multiple residues can be inserted here. • Insertion states are entered from one match state and then exited to the next match state: insertion occurs between adjacent amino acids.
Deletion States • Deletions are places in multiple alignments where most of the sequences have amino acids but a few of them have gaps. • Deletion states are used to skip over match states. • You can skip multiple match states by moving from one deletion state to the next. • Deletion states act like affine gap penalties: the transition probability for entering a deletion state from a match state is equivalent to the gap opening penalty, and the transition probability from one deletion state to the next is the gap extension penalty. • Unlike match states and insertion states, deletion states are silent: they emit nothing.
The Full HMM • A full HMM model for a making a profile of a multiple alignment. • Note that it is necessary to have begin and end states too, and often a bit more complicated than is shown here. These are needed to deal with local alignments as opposed to global. • HMMs also usually have transitions directly from insertion states to deletion states, but these are considered very improbable, but their existence helps in model building.
Determining the Parameters • Start with a good multiple alignment, which generally involves hand refinement. This is often refered to as “curated”. • Most of the columns will become match states. • Pseudocounts are needed to make sure that each match state has a non-zero probability of emitting all 20 amino acids. • Insertion and deletion states are given some background low transition probabilities to start with. • columns that are mostly gaps are considered insertion states, and gaps in columns with mostly amino acids are modeled with deletion states.
Using Profile HMMs • The query sequence is used as a set of observations that are emitted from the HMM if the proper path is followed. • Either the Viterbi algorithm (to give the probability for the most likely path) or the forward algorithm (to give the probability of emission by all possible paths) can be used. • To get log-odds scores, the probability of emitting the sequence from the model is compared to the probability of generating it randomly given the background frequencies of each amino acid.
HMM Collections • The J. Craig Venter Institute (formerly known as TIGR) has a large collection of HMMs, called TIGRFAMS. • They are classified according to their isology: how specific they are. The least specific are motifs, then domains, then families (super and sub), and most specific are equivalogs. • Equivalogs are homologous proteins which all have the same function. They are usually full length proteins, not just domains. • A good hit on an equivalog is strong evidence that you have determined the protein’s function. • Lots of useful information about the HMMs also. • Two cutoff scores: above the trusted cutoff there should be no false positives. Below the noise cutoff the match is of no value. • http://www.jcvi.org/cms/research/projects/tigrfams/overview/ • A bit slow, in my opinion. • Search results are not linked: you need to do the sequence search, then go to the text search to see what they mean.
PFAM • PFAM: probably stands for “Protein Families”. • http://pfam.sanger.ac.uk/ • Two types: PFAM-A is manually curated, and PFAM-B is automatically generated from a larger database. • PFAM HMMs are generally domains as opposed to full-length proteins. • The JCVI site also includes PFAM HMMs, but the actual PFAM site has search results with links to information about them.