Download
1 / 66
660 likes | 853 Views
Climate Change and Species Interactions in Natural and Agricultural Ecosystems Dan Herms Department of Entomology The Ohio State University Ohio Agricultural Research and Development Center Wooster, OH herms.2@osu.edu. The 10 warmest years since 1000 AD: 2005 2009 1998

E N D
Climate Change and Species Interactions in Natural and Agricultural Ecosystems Dan Herms Department of Entomology The Ohio State University Ohio Agricultural Research and Development Center Wooster, OH herms.2@osu.edu
The 10 warmest years since 1000 AD: • 2005 • 2009 • 1998 • 4. 2007 • 5. 2002 • 6. 2006 • 7. 2003 • 8. 2004 • 9. 2001 • 10. 2008 (warmest La Niña year on record) Source: NASA Goddard Institute for Space Studies
Global warming indicated by: • 3 independent surface temperature records: • NASA, NOAA, Hadley Climate Research Unit • Corroborated by: • 2 satellite records of upper and lower troposphere • Weather balloons • Proxy reconstructions (e.g. tree rings, boreholes, ice cores, • glaciers, coral, etc.) • Changes in Earth’s physical and biological systems.
Is the Earth warming? 30 year trends: • Increasing air temperature in lower atmosphere. • Increasing temperature over land. • Increasing temperature over oceans. • Increasing sea-surface temperature. • Increasing ocean heat content. • Increasing humidity. • Increasing sea level. • Decreasing glacier cover. • Decreasing sea ice cover. • Decreasing snow cover. • NOAA National Climatic Data Center, 2010
...increasing atmospheric CO2 from 280 ppm in 1800 to 390 ppm today http://www.bom.gov.au/info/climate/change/gallery/images/25.jpg
Objectives: • Global warming and the distribution of species. • Global warming and phenology: • Phenological change as evidence of global warming. • Modeling changes in phenology of agricultural pests. • Global warming and ecological disruption. • Decoupling of species interactions. • Effects on population dynamics. • Atmospheric CO2, plant quality, and herbivores.
Signs of warming are everywhere Parmesan & Yohe. 2003. A globally coherent fingerprint of climate change impacts across natural systems. Nature 421:37-42.
Glaciers are melting world-wide Glacier Bay 1909 2000 http://www.coasttocoastam.com/timages/page/glacier_bay012905.jpg Toboggan Glacier Oerlemans, J. 2005. Extracting a climate signal from 169 glacier records. Science 308:675-677.
Glacier National Park: Number of glaciers in 1910 when park formed: 150 Number of glaciers today: 25 http://www.globalwarmingart.com
Coral is bleaching across the globe http://www.lizasreef.com Rachel Donnelly www.unep-wcmc.org Hoegh-Guldberg, O. 1999. Climate change, coral bleaching and the future of the world's coral reefs. Marine and Freshwater Research 50:839–866.
Sea level is rising: 20 cm in the last century R.A. Rhohde, www.globalwarmingart.com Recent sea-level contributions of the Antarctic and Greenland ice sheets (2007) Science 315:1529-1532.
http://discoverbiodiversity.com/LarisaDeSantis.html http://www.globalwarmingart.com
In this century, the range of 23 of 35 European butterfly species shifted north 35-240 km Argynnis paphia Parmesan et al. 1999. Nature 399:579-583
Suitable years (of 24 possible) for premium winegrape production in the current (Daymet) and future (ΔDaymet) climates for four categories of grape/vine tolerance to extreme temperatures: HTCT (a and b), HICT (c and d), HTCI (e and f), and HICI (g and h). White M A et al. PNAS 2006;103:11217-11222 ©2006 by National Academy of Sciences
The largest recorded bark beetle outbreak in human history in northern British Columbia where winters used to be too cold for the beetles to survive. http://www.for.gov.bc.ca/hfp Dezene Huber, UNBC http://www.garna.org/ Kurz et al. 2008. Mountain pine beetle and carbon feedback to climate change. Nature 452:987-990.
BioScience (2007) 57:939-948 http://www.fas.org/irp/imint/docs/rst/Sect16/Sect16_2.html
Phenology: The study of recurring biological events and their relationship to climate.
“The world’s oldest science.” “The foundational science of agriculture, and thus of human civilization.” http://media-2.web.britannica.com/
Climate change at Thoreau’s Walden Pond “We determined that plants bloomed seven days earlier on average than they did in Thoreau’s times.” Miller-Rushing and Primack. 2008. Global warming and flowering times in Thoreau’s Concord: a community perspective. Ecology 89:332-341.
Climate change and phenology at Sand County, WI “The mean of regressions for the 55 phenophases studied was -0.12 day / yr, an overall increase in phenological earliness…” Bradley et al. 1999. Phenological changes reflect climate change in Wisconsin. PNAS 96:9701-9704.
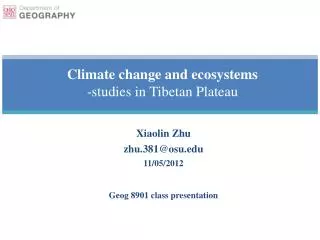
Change in growing season from satellite imagery (days / decade) Badeck et al. 2004. Responses of spring phenology to climate change. New Phytologist 162:295-309
Projected Climate Change Scenario for Ohio Union of Concerned Scientists
OARDC is part of the National Phenology Network that has documented earlier springs in NA Lilac bloom as a phenological indicator of continental-scale climate change.
D.G. Nielsen, Ohio State University D.G. Nielsen, Ohio State University Black vine weevil now emerging 2-3 weeks earlier than in 1970 Gina Penny
Extensive series of phenological records of native plants for Columbus at the dawn of the Industrial Revolution (1882-1887)
Fire: more frequent and more intense Since 2000:6 worst wildfire years on record. Since 2002:Acreage burned is 211% higher than 48 year average. Science (2208) 319:1080-1083 John McColgan, BLM Alaska Fire Service Westerling et al. 2006. Warming and earlier spring increase western US forest wildfire activity. Science 313:940-943
Development rate of plants and insects is temperature dependent.
Daily temperature readings can be used to calculate growing degree-days (heat units), which measure accumulated heat.
Calculating Growing Degree-Days: DD = Avg Temp – Base Temp Max = 70, Min = 40 70 + 40 2 - 50 = 5 DD
Implications of Climate Change for Agricultural Pest ManagementOARDC SEEDS Interdisciplinary Project Robin A. J. Taylor John Cardina Department of Entomology Department of Horticulture & Crop Science Daniel A. Herms Richard H. MooreDepartment of Entomology Human and Community Resource Development
Phenological Modeling • Based on GFDL (NOAA) global circulation model CM2-SRES-B1 scenario developed for IPCC-4A • Assumes political will exists to stabilize climate warming by 2050
Velvetbean Caterpillar http://entnemdept.ufl.edu
European Corn Borer www.organicgardeninfo.com
Bird phenology Between 1971 and 1995 the laying date for many species of British birds has shifted earlier by an average of 9 days. (Nature 388: 526) Breeding date of North American common murre advanced by 24 days / decade
Phenology, Communities, and Ecosystems Morisette et al. 2009. Frontiers in Ecology and the Environment 5(7):253-260
Global warming and phenological asynchrony Interacting species with differential responses to increased temperature. For example: Plant - herbivore interactions Plant - pollinator interactions Predator-prey interactions Bird migration and prey availability
Phenological Window Hypothesis (Feeny 1976, Mattson et al. 1982) • A “window” of time when host traits are most suitable for the insect • Predicts that insect growth and survival will decline as host-insect synchronicity is modified
European pine sawfly (Neodiprion sertifer) Dr. Rodrigo Chorbadjian
Constrained life-cycle Hatch cocoon Winter April May June --- Sept One generation each year Feeds on previous-year needles during a short window of time
Insect phenology manipulated relative to natural host phenology Control bioassay: Natural hatch Advanced bioassays Delayed bioassays Winter March April May June Sept