Download
1 / 36
390 likes | 587 Views
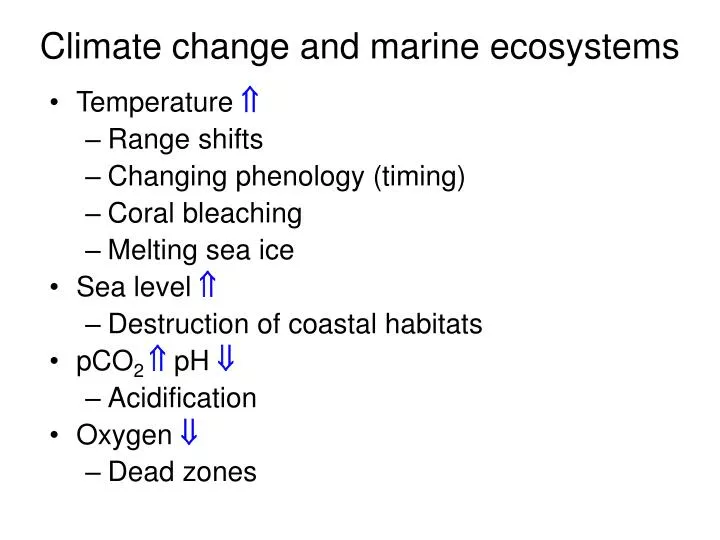
Climate change and marine ecosystems. Temperature Range shifts Changing phenology (timing) Coral bleaching Melting sea ice Sea level Destruction of coastal habitats pCO 2 pH Acidification Oxygen Dead zones .

E N D
Climate change and marine ecosystems • Temperature • Range shifts • Changing phenology (timing) • Coral bleaching • Melting sea ice • Sea level • Destruction of coastal habitats • pCO2 pH • Acidification • Oxygen • Dead zones
Climate change and marine ecosystems • Temperature • Range shifts Today • Changing phenology (timing) Today • Coral bleaching Today • Melting sea ice Today • Sea level • Destruction of coastal habitats Today • pCO2 pH • Acidification Monday • Oxygen • Dead zones Monday
All of these changes result from rising [CO2], mainly through its effects on temperature
2011-2030 2046-2065 2080-2099 IPCC Report 2007
Species ranges are temperature-dependent “relative abundance” = Fraction of maximum abundance Cheunget al. 2009
Estimated 2050 distribution of N=1066 species using projected temperature map Ninvasion= # Invasions by 2050 # species in 2001-2005 (Note smaller scale for extinction) Nextinction= # Extinctions by 2050 # species in 2001-2005 Cheunget al. 2009
Predicted distribution of biodiversity impact dueto warming-induced range shifts Turnover = | Ninvasion-Nextinction | N=1066 species Cheunget al. 2009
Warming and stratification of North Atlantic affect timing of some plankton blooms Dinoflagellate Diatom Data from continuous plankton recorder Edwards and Richardson 2003
Trophic match/mismatch: Haddock survival affected by timing of larvae and algal blooms Bloom anomalies calculated as difference in bloom timing (in weeks) from the mean timing for the series Platt et al. 2003
Temperature and Coral Bleaching Healthy corals have Zooxanthellae -Symbiotic unicellular algae -Photosynthetic -Algal pigments provide coral color -Provide up to 90% of coral’s energy High temperature causes coral to expel their zooxanthellae -Coral turn white: “Bleaching” -Coral lose their main energy source -If severe, results in death
Bleaching occurs above a threshold temperature 1-2o C above the long-term summer max temperature Bleaching threshold varies among species and systems Hoegh-Guldberg (1999)
Summer of 2010 was one of the worst on record for bleaching in Northern latitudes, Caribbean Stress LevelPotential Bleaching Intensity No Stress No Bleaching Watch Warning Possible Bleaching Alert Level 1 Bleaching Likely Alert Level 2 Mortality Likely http://coralreefwatch.noaa.gov/satellite/index.html
Current bleaching outlook is fairly mild Stress LevelPotential Bleaching Intensity No Stress No Bleaching Watch Warning Possible Bleaching Alert Level 1 Bleaching Likely Alert Level 2 Mortality Likely
“Business as usual” model projections of SST: Likely wide-spread die-off of coral reefs by the end of the century Central Pacific Southeast Asia Caribbean Hoegh-Guldberg (1999)
Sea level rise Recall that the main cause of sea-level rise is thermal expansion IPCC Report 2007
Figure 10.32.Local sea level change (m) due to ocean density and circulation change relative to the global average (i.e., positive values indicate greater local sea level change than global) during the 21st century, calculated as the difference between averages for 2080 to 2099 and 1980 to 1999, as an ensemble mean over 16 AOGCMs forced with the SRES A1B scenario. Stippling denotes regions where the magnitude of the multi-model ensemble mean divided by the multi-model standard deviation exceeds 1.0.
Coastal ecosystems affected by sea level rise Mangroves Salt marshes Important habitat for fish and invertebrates Very productive, fix lots of organic carbon
Sea level rise likely to reduce diversity & distribution of mangroves and seagrass habitats Indonesia and Indian Ocean have greatest diversity + large projected rise in sea level
Tidal marsh response to sea level rise of 40 cm Vegetation Mean sea level Upland migration of intertidal zones compresses marsh habitat but can increase area of tidal flat habitat Moorhead and Brinson 1995
Coastal ecosystems threatened by both sea level rise and coastal development MSL1 = old sea level MSL2 = new sea level Bird et al. 1995
Sea-ice melting: different in Arctic and Antarctic Arctic Antarctic http://nsidc.org/sotc/sea_ice.html
Melting sea ice - more extreme at North pole than at South pole -More warming projected in the Arctic than in the Antarctic -Arctic covered in ice cap, Antarctic covered in land mass
Sea ice projections (IPCC Report Fig 10.14) 1980-2000 Winter Summer 2080-2100 Winter Summer Sea ice concentration (% of time)
Arctic polar ice cap melting in summer Current September sea-ice extent Average September sea-ice extent from 1979 to 2000 • Arctic has had permanent (year-round) sea ice for last 5000 years. • Recent summer sea-ice extent is nearly 50% lower than 1979-2000 extent. • Arctic summer sea-ice may disappear within 10 to 20 years.
Arctic: Polar bears live, hunt, and raise cubs on sea ice-Loss of summer ice means more energy needed for hunting, camouflage less effective
Polar bear survival probabilities from 2001-2006 mark-recapture data Dots indicate location of each polar bear caught Hunter et al. 2010
Relate population growth rate to “Ice(t)”, the number of ice-free days per year If growth rate <1, population is shrinking Need <127 ice-free days for population growth Hunter et al. 2010
Extinction probability Projected ice-free days 2005 2025 2045 2065 2085 2105 2005 2025 2045 2065 2085 2105 10 circulation models Predict # ice-free days + Population model (depends on Ice(t)) Population projections >80% probability of extinction by 2100 Hunter et al. 2007
New model suggests emissions cap could lessen risk of extinction Sea ice cover in September, the most ice-free month “Business as usual” 2020 Emissions cap 2020 emissions cap scenario predicts <25% extinction probability Amstrup et al. 2011
Polar bears - current status: “Threatened” • 2010: 187,000 mi2 in Alaska, mostly sea ice area, set aside as “critical habitat” • “Threatened” status can’t be used to regulate greenhouse gases or influence climate policy • December 2010: President Obama denied upgrade of polar bears to “endangered” status • July 2011: Federal judge agreed with President Obama, ruled that polar bears are merely “threatened”
Antarctic sea-ice extent has increased slightly, mainly in the Ross Sea Average September sea-ice extent from 1979 to 2000 Current September sea-ice extent Sea ice extent is defined as the total area in which the ice concentration is at least 15 percent.
Although Antarctic sea ice is not shrinking on average, there are occasional large ice losses Larsen B ice sheet collapse 2002 Despite slight increases in Antarctic ice extent, large sections of ice sheets have broken off in recent years.
Antarctica: Emperor penguins sensitive to sea ice extent-Too much ice: Foraging trips too long, lower survival-Ice breaks up too soon: chicks die before fledging
Emperor Penguins Population model Demographic data set + Global climate models Predictions of sea ice extent Population projections 1972-1981: 11% per year reduction in sea ice 50% decline in penguin population -Penguin survival sensitive to changes in sea ice >36% probability of quasi-extinction (95% decline) by 2100 -“To avoid extinction, emperor penguins will have to adapt, migrate, or change the timing of their growth stages.” Jenouvrier et al. 2008