Download
1 / 1
10 likes | 133 Views
P1.56 Seasonal, Diurnal, and Weather Related Variations of Clear Sky Land Surface Temperature: A Statistical Assessment K. Y. Vinnikov (University of Maryland, kostya@atmos.umd.edu), Y. Yu, M. K. Rama Varma Raja, J. D. Tarpley, and M. D. Goldberg (NESDIS/NOAA ).

E N D
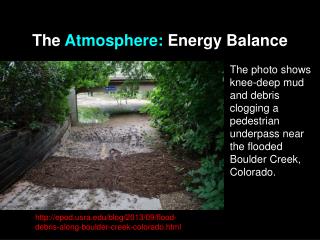
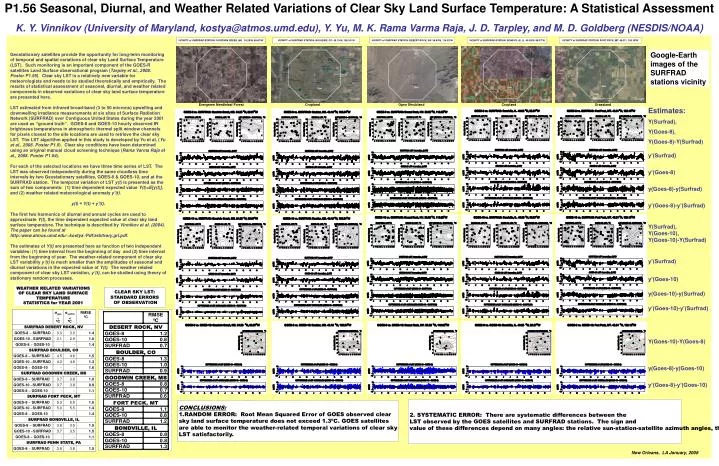
P1.56 Seasonal, Diurnal, and Weather Related Variations of Clear Sky Land Surface Temperature: A Statistical Assessment K. Y. Vinnikov (University of Maryland, kostya@atmos.umd.edu), Y. Yu, M. K. Rama Varma Raja, J. D. Tarpley, and M. D. Goldberg (NESDIS/NOAA) VICINITY of SURFRAD STATION: GOODWIN CREEK, MS. 34.25ºN, 89.87ºW VICINITY of SURFRAD STATION: BOULDER, CO. 40.13oN, 105.24o W VICINITY of SURFRAD STATION: DESERT ROCK, NV. 36.63ºN, 116.02ºW VICINITY of SURFRAD STATION: BONDVILLE, IL. 40.05ºN, 88.37ºW VICINITY of SURFRAD STATION: FORT PECK, MT. 48.31º, 105.10ºW Google-Earth images of the SURFRAD stations vicinity Geostationary satellites provide the opportunity for long-term monitoring of temporal and spatial variations of clear sky Land Surface Temperature (LST). Such monitoring is an important component of the GOES-R satellites Land Surface observational program (Tarpley et al., 2008. Poster P1.55). Clear sky LST is a relatively new variable for meteorologists and needs to be studied theoretically and empirically. The results of statistical assessment of seasonal, diurnal, and weather related components in observed variations of clear sky land surface temperature are presented here. LST estimated from infrared broad-band (3 to 50 microns) upwelling and downwelling irradiance measurements at six sites of Surface Radiation Network (SURFRAD) over Contiguous United States during the year 2001 are used as “ground truth”. GOES-8 and GOES-10 hourly observed IR brightness temperatures in atmospheric thermal split window channels for pixels closest to the site locations are used to retrieve the clear sky LST. The LST algorithm applied in this study is developed by Yu et al. (Yu et al., 2008. Poster P1.9). Clear sky conditions have been determined using an original manual cloud screening technique (Rama Varma Raja et al., 2008. Poster P1.64). For each of the selected locations we have three time series of LST. The LST was observed independently during the same cloudless time intervals by two Geostationary satellites, GOES-8 & GOES-10, and at the SURFRAD station. The temporal variation of LST y(t) is presented as the sum of two components: (1) time dependent expected value Y(t)=E[y(t)], and (2) weather related meteorological anomaly y’(t). y(t) = Y(t) + y’(t). The first two harmonics of diurnal and annual cycles are used to approximate Y(t), the time dependent expected value of clear sky land surface temperature. The technique is described by Vinnikov et al. (2004). The paper can be found at http:/www.atmos.umd.edu/~kostya /Pdf/arbitrary.grl.pdf. The estimates of Y(t) are presented here as function of two independent variables: (1) time interval from the beginning of day and (2) time interval from the beginning of year. The weather-related component of clear sky LST variability y’(t) is much smaller than the amplitudes of seasonal and diurnal variations in the expected value of Y(t).The weather related component of clear sky LST variation, y’(t), can be studied using theory of stationary random processes. 2km 2km 2km 2km 2km Evergreen Needleleaf Forest Cropland Open Shrubland Cropland Grassland Estimates: Y(Surfrad), Y(Goes-8), Y(Goes-8)-Y(Surfrad) y’(Surfrad) y’(Goes-8) y(Goes-8)-y(Surfrad) y’(Goes-8)-y’(Surfrad) Y(Surfrad), Y(Goes-10), Y(Goes-10)-Y(Surfrad) y’(Surfrad) y’(Goes-10) y(Goes-10)-y(Surfrad) y’(Goes-10)-y’(Surfrad) Y(Goes-10)-Y(Goes-8) y(Goes-8)-y(Goes-10) y’(Goes-8)-y’(Goes-10) WEATHER RELATED VARIATIONS OF CLEAR SKY LAND SURFACE TEMPERATURE STATISTICS for YEAR 2001 CLEAR SKY LST:STANDARD ERRORS OF OBSERVATION 2. SYSTEMATIC ERROR: There are systematic differences between the LST observed by the GOES satellites and SURFRAD stations. The sign and value of these differences depend on many angles: the relative sun-station-satellite azimuth angles, the zenith angle of sun, and the zenith angle of observation. These systematic differences depend on the time of a day and on the season. At least one full year of observations is needed to evaluate these systematic differences. • CONCLUSIONS: • RANDOM ERROR: Root Mean Squared Error of GOES observed clear • sky land surface temperature does not exceed 1.3ºC. GOES satellites • are able to monitor the weather-related temporal variations of clear sky • LST satisfactorily. New Orleans, LA January, 2008