Download
1 / 68
740 likes | 948 Views
Linkage Equilibrium / Disequilibrium. Evolution at Multiple Loci. Deals with the consideration of two loci simultaneously The loci are physically linked on the same chromosome Locus A with alleles “ A ”, “ a ” and locus B with alleles ” B ” and “ b ”

E N D
Linkage Equilibrium / Disequilibrium Evolution at Multiple Loci
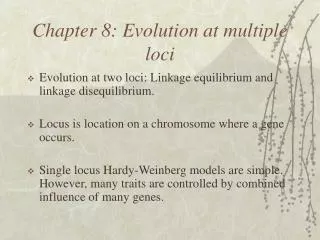
Deals with the consideration of two loci simultaneously The loci are physically linked on the same chromosome Locus A with alleles “A”, “a” and locus B with alleles ”B” and “b” We track not only frequencies of alleles but also frequencies of chromosomes The setting and terminology
Possible chromosome genotypes for this example are: AB; Ab; aB; ab • These multi-locus genotypes of chromosomes (or gametes) are called haplotypes ( for haploid genotype) • These haplotypes may occur in either Linkage Equilibrium or Linkage Disequilibrium More terminology
Have genotypes that are independent of one another. • If you know the genotype at one locus (A) you cannot predict what the genotype will be at the other locus (B). • Example: Suppose that the gene which controls the length of toes in frogs (A) is linked to the gene that controls the amount of webbing between the toes (B). • Populations that are in linkage equilibrium will show no correlation between toe length and the degree of webbing between them. Loci which are linked together in Linkage Equilibrium:
Genotypes of the chromosomes (Haplotypes) exhibit a nonrandom association between the linked genes. • If you know the genotype at one locus (A) you have a clue about the genotype at the other locus (B). • Example: back to the gene which controls the length of toes in frogs which is linked to the gene that controls the amount of webbing between the toes. • Populations that are in linkage disequilibrium will show a correlation between toe length and the degree of webbing between them. • For instance we might observe that the shorter the toes the more webbing and the longer the toes the less webbing that occurs. Loci which are in Linkage Disequilibrium
Figure 8.2a • If the frequencies of the haplotypes can be calculated by multiplying the frequencies of the two alleles involved, then they are in linkage equilibrium. • Also, if the occurrence of “B” allele is equally likely on either the A or the a chromosome the alleles are in linkage equilibrium Linkage equilibrium
If the frequencies of the haplotypes cannot be calculated by multiplying the frequencies of the two alleles involved, then they are in linkage disequilibrium • The occurrence of “B” allele is not equal on the A and the a chromosomes Linkage Disequilibrium
If selection acts on one locus only.... • Selection for the “A” allele has no effect on the “B” allele frequency. See Figure 8.8b In Linkage Equilibrium A= 5/25 = .2; a= .8 A = 20/25 = .8; a= .2B = 20/25 = .8; b= .2 B= 20/25 =.8; b =.2
4 4 16 • If selection acts on one locus only.... • Selection for the “A” allele changes the B allele frequencies also. As a chromosomes are lost they drag “B” alleles along in a disproportionate fashion. See Figure 8.8a In Linkage Disequilibrium A= 5/25 = .2; a =.8 A = 20/25 = .8; a = .2B= 17/25 = .68; b= .32 B= 8/25 = .32; b= .68
Actual haplotype frequencies • In linkage equilibrium chromosome (haplotype) frequencies do not change, they can still be predicted (calculated) from allele frequencies. “B”=20/25=.8 “b”5/25 = .2 “A”20/25= .8 “a”5/25= .2 AB= .64 Ab = .16 aB= .16 ab = .04 AB= 16/25 =.64 Ab= 4/25 = .16 aB = 4/25 = .16 ab =1/25 = .04 Linkage equilibrium Calculated haplotype frequencies
actual • In linkage disequilibrium chromosome frequencies change, they can not be predicted (calculated) from allele frequencies. “B”8/25= .32 “b”17/25 = .68 “A”20/25= .8 “a”5/25= .2 AB=.256 Ab = .544 aB= .064 ab = .136 AB= 4/25 =.16 Ab= 16/25 = .64 aB = 4/25 = .16 ab =1/25 = .04 Linkage disequilibrium calculated
The frequency of “B” on chromosomes carrying allele “A” is equal to the frequency of “B” on chromosomes carrying allele “a”. • The frequency of any chromosome haplotypes can be calculated by multiplying the frequencies of the alleles which compose that haplotype • The quantity D, (coefficient of disequilibrium)=0 D= gABgab- gAbgaB g is the frequency of the various haplotypes Three tests for linkage Equilibrium Verify
selection on multilocus genotypes genetic drift population admixture What causes linkage disequilibrium
If we use the population from figure 8.2 (p. 283) to provide gametes to the next generation which is now undergoing multilocus selection we have a possibility of the following haplotypes in each gamete: ABAbaB or aB • The frequencies of the possible zygotes formed by this population in the next generation are given by: Selection on multilocus genotypes
View punnett square AABB (.2034) AABb (.0576) AaBB (.1536) AaBb (.0384) AABb (.0576) AAbb (.0144) AaBb (.0384) Aabb (.0096) AaBB (.1536) AaBb (.0384) aaBB (.1024) aaBb (.0256) AaBb (.0384) Aabb (.0096) aaBb (.0256) aabb (.0064) This population is in Linkage equilibrium until…. See Figure 8.3 pg 287
Differential selection now acts on this population such that…. All individuals which are smaller than 13 units in size (indicted by individuals with less than 3 dominant alleles) are eaten by predators and eliminated from the population, Leaving ……
A population that is now in disequilibrium How can we verify that this population is in linkage disequilibrium?
Looking at the last figure we can count the frequency of B on A and on a Test #1 Frequency of B alleles on “A” and “a” chromosomes is the same B on A = .88 B on a = 1.0
a= • b= Test #2 the frequency of any haplotype can be calculated by multiplying the frequencies of constituent alleles ½ (.1536+.1536)/.6528 = 0.24 • ab frequency should be .02 but it is actually 0 ½ (.0576 + .0576)/.6528 = .09
D= gABgab - gAbgaB gab = 0 so D = a negative value and D is not = 0 Finally we test to determine if the linkage equilibrium value for D is equal to zero
Let’s look at problem # 3 on page 313. Work with the people at your table to answer part a. Let’s try another scenario using these same chromosomes
Genetic drift and population admixture also disrupt linkage equilibrium We will not be doing examples of these. If you are interested please refer to your text on pages 288-289. We have just examined how selection on multilocus genes can lead to linkage disequilibrium
If populations are in linkage disequilibrium, single locus models (Hardy Weinberg) may yield inaccurate predictions about the population.WHY? Why and when does disequilibrium matter
We will now investigate the role of sexual reproduction in the behavior of linked genes
First we will investigate the basic concepts of sexual reproduction as it relates to the distribution of alleles in offspring.
Get genetic recombination due to: Meiosis and crossing over Random mating between unrelated individuals Millions of different gametes produced by each parent Billions of possible combinations of gametes for each mating • In every generation alleles which are part of a multilocus genotype will appear in different combinations • An example from a highly simplified example using eye color and hair color alleles. Why sexual reproduction leads to genetic diversity ?
Which haplotypes are possible in the gametes from this parent? Haplotypes possible are rb or RB only
Eye color Hair color Now we have all four haplotypes rb; RB; Rb; and rB Genetic recombination shuffles genotypes for multilocus genes and will reduce genetic disequilibrium
Because of crossing-over and outbreeding, Sexual reproduction reduces linkage disequilibrium • Meiosis and sexual reproduction lead to genetic recombinations of genes linked on the same chromosome • Genetic recombination tends to randomize genotypes at one locus with respect to genotypes at another locus on the same chromosome • The result is a reduction in linkage disequilibrium • The greater the rate of crossing over between two loci, the faster linkage disequilibrium will be eliminated by sexual reproduction Sexual reproduction reduces linkage disequilibrium
Fruit fly experiments of Michael Clegg Started with two populations both in total linkage disequilibrium and at the opposite ends of the disequilibrium scale Within 50 generations of sexual reproduction, all of the populations were approaching linkage equilibrium An experiment on the effects of sexual mating and equilibrium at two loci
The adaptive significance of sex: A closer look at the importance of the role of reproductive strategies in the survival and evolution of species
Sexual reproduction: The cost is too high Many potential barriers to successful reproduction What are some of them? finding a mate • cooperation between mates • sexual diseases • mating may prove infertile and result in no offspring • Asexual Reproduction Asexual reproduction is so much more efficient and produces so many more offspring The offspring of the original parent are clones so they may be better adapted to the environment and survive and reproduce more
John Maynard Smith(1978) developed a null model to explore the evolutionary fate of a population under sexual reproduction versus asexual reproduction. • Involves two assumptions If both of these assumptions are met then one form of reproduction will not be favored over the other 1. A female’s reproductive mode does not affect the number of offspring she can produce. 2. A female’s reproductive mode does not affect the probability that her offspring will survive Which reproductive mode is better for survival ?
The asexuals will constitute an increasingly larger percentage of the population in each generation and should completely take over As figure 8.17 shows, assumption # 1 is not met. Asexual parthenogenetic females will produce larger numbers offspringthan sexual reproducers (16 of 24 are asexual) Pg 304
Just a single mutation in a sexually reproducing population that produces an asexual female will lead to inevitable takeover by asexuals • This is not what happens in reality and sexual and asexual forms of many species coexist just fine • For sexual species to coexist means they must confer some benefit for survival • This benefit could lie in violation of either or both assumptions What are the potential consequences?
...for instance when paternal care of the young is required Sexual populations would leave more young because asexuals could not take care of their young and not as many would survive. Not may species fall into this category. There would be a violation of Assumption #1 if…. A female’s reproductive mode doesaffect the number of offspring she can produce
A study with flour beetles Dunbrack and colleagues set up a study that compared asexual populations and sexual populations of flour beetles and compared the ability of the two population to respond to an environmental stress, namely the application of an insecticide to their food. Figure 8.18 shows the results A violation of assumption #2 is more likely This would be violated if a female’s reproductive mode doesaffect the probability that her offspring will survive
The control alone, would supports assumption #1 that if there is an advantage in the number of offspring produced then that type of reproduction should be favored 10 20 30 Looking at this experimental population and comparing it to the control shown above, we see that there appears to be a definite advantage to sexual reproduction. The sexually reproducing population eventually eliminated the asexual population when exposed to selection stress. Why is this? Figure 8.18 pg 306 10 20 30
Therefore if a population is already in linkage equilibrium there is no advantage to sexual reproduction • Population-genetic Models which propose evolutionary benefits for sex must include two things 1. A mechanism to produce linkage disequilibrium 2. An explanation for why genes that tend to reduce disequilibrium are favored At the level of population genetics, reduction of linkage disequilibrium is the onlyconsequence of sex
There are two categories of models based on the source of linkage disequilibrium 1. Those that propose genetic drift 2. Those that propose selection on multilocus genotypes. Theories dealing with the advantages of sexual reproduction
Linkage disequilibrium is most often a problem in asexual populations since sexual reproduction tends to eliminate linkage disequilibrium In freely mating populations most pairs of loci should be in linkage equilibrium and single-locus models will work well most of the time Pairs of genes most likely to show disequilibrium are those that are situated so closely together on the chromosome that crossing over between them is rare.
Works in populations which are small, where drift is a potent mechanism As mutations occur in asexual populations, they are passed on to all offspring of the asexual parent Over time several mutations can be accumulated in a population(the frequency of each individual mutant allele is a balance between mutation rate, the strength of selection and genetic drift) Asexual populations are doomed to accumulate deleterious mutations which are passed on to all offspring Asexual populations cannot get rid of the mutations which are accumulating until the population is eliminated Muller’s Ratchet : Genetic Drift plus Mutation can make sex beneficial