Download
1 / 28
280 likes | 414 Views
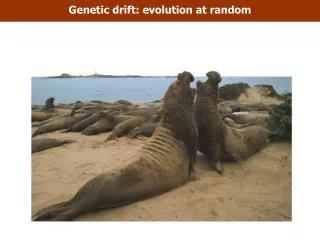
In a population, size N, a new mutation has a frequency 1/2N = probability of that it will eventually become fixed. So, a new mutation has a higher probability of fixation in a small population.If the same mutation arises in many populations of size N, it will become fixed in 1/2N of them.Of al

E N D
1. Drift leads to fixation at all loci If genetic drift is the only force operating within a population, all loci will eventually become fixed for a single allele. This means there is no genetic variation left within such a population.
2. Consequences of Drift
4. Drift usually occurs faster than in simulations because simulations assume: Equal numbers males
and females
If there are 200 females, but only 50 males that contribute to the next generation [as in fig wasps], then the population has a census size of 250, but it will undergo drift as if it had a census size of Ne=[4NfNm]/[Nf+Nm]= 160.
5. Drift actually occurs faster than in simulations because simulations assume: Constant population size
If the population size varies across generations, then a population that has a census size of Ni, over n generations, will undergo drift as if it had a census size of:
6. Example N1 = 100,000
N2 = 100
N3 = 100,000
7. Drift actually occurs faster than in simulations because simulations assume: No selection
If there is greater than random variation in reproductive success, then
8. Red Deer (Cervus elaphus) 35 females, Vf=9
33 males, Vm=42
Ne=?
9. Effective size of a population is typically much less than the census size
10. In small populations, both genetic drift and inbreeding contribute to loss of genetic variation All individuals will be related if small size persists for many generations.
There will be loss of alleles and loss of heterozygosity.
11. Florida panther, Felis concolor coryi
12. Drift removes genetic variation Large population size
Migration between subpopulations
Mutation
�Balancing� natural selection (frequency-dependent selection, heterozygote advantage, varying selection pressure.
13. Population Differentiation
14. Genetic drift causes populations to diverge
16. Consider this a metapopulation What are the allele frequencies at Gen. 19?
What are the genotype frequencies?
Would you observe deviations from H-W genotypic proportions?
17. Changes in Heterozygosity caused by Drift If a metapopulation is divided into subpopulations, subpopulations will undergo drift and alleles tend to become fixed:
HE=2pq, as p or q --> 0, HE-->0
Across the whole metapopulation, there are fewer heterozygotes thatn there would be in a single, panmictic (all interbreeding) population of the same size.
18. Measures of population differentiation Sewall Wright: one of the founders of population genetics, born in Illinois, got a Master�s degree at Univ. Illinois, and spent most of his career as a professor at the University of Chicago.
Invented �F Statistics� to understand the genetic effects of population structure.
Note: These are not the same as the �F ratio� used in the statistical procedure called Analysis of Variance.
19. Measures of heterozygosity needed for F statistics HI = observed heterozygosity (proportion heterozygotes) within a subpopulation.
HS = expected heterozygosity within a subpopulation. If there are i different alleles at a locus in a subpopulation, pi is the frequency of the ith allele:
HT = expected heterozygosity if there was random mating across the entire metapopulation.
= average frequency of the ith allele across all subpopulations:
20. F statistics FST is the statistic that tells us how differentiated the subpopulations are. Formally, FST tells us if there is a deficit of heterozygosity in the metapopulation, due to differentiation among subpopulations:
Bars mean that the values are the averages over all the subpopulations that we are considering.
21. F statistics FIS tells us if there is inbreeding within subpopulations by comparing HI and HS:
Bars mean that the values are the averages over all the subpopulations that we are considering.
So FIS measures whether there is, on average, a deficit of heterozygotes within subpopulations.
22. F statistics FIT tells us how much population structure has affected the average heterozygosity of individuals within the population:
Also (1-FIS) (1-FST) = (1-FIT).
23. Two Structured Populations
24. Intuitive meaning of FST The proportion of total genetic variation that is distributed among subpopulations, rather than within subpopulations.
25. Metapopulation structure: Drift within populations, migration between populations
26. Drift and migration have opposite effects Drift makes subpopulations differerent
Migration homogenizes subpopulations
27. Population differentiation under migration and drift If Ne and m are small, FST is large
If Nem < 1 then
FST > 0.2
�If there is > 1 migrant per generation, populations do not diverge much.�
28. Useful for estimating gene flow If you know FST and Ne, you can calculate m