Download
1 / 16
160 likes | 301 Views
Lecture 7 (9/27/2006) Crystal Chemistry Part 6: Phase Diagrams. Gibbs Free Energy. G – the energy of a system in excess of its internal energy. (This is the energy necessary for a reaction to proceed) G = E + PV - TS dG = VdP – SdT at constant T ( δ G/ δ P) T = V

E N D
Lecture 7 (9/27/2006)Crystal ChemistryPart 6: Phase Diagrams
Gibbs Free Energy • G – the energy of a system in excess of its internal energy. (This is the energy necessary for a reaction to proceed) G = E + PV - TS dG = VdP – SdT at constant T (δG/δP)T = V at constant P (δG/δT)P = -S Stable phases strive to have the lowest G Therefore, the phase with the highest density at a given pressure and the highest entropy at a given temperaturewill be preferred
Clapeyron Equation • Defines the state of equilibrium between reactants and product in terms of S and V dGr = VrdP – SrdT dGp = VpdP – SpdT at equilibrium: VrdP – SrdT = VpdP – SpdT or: (Vp –Vr) dP = (Sp –Sr) dT or: dP/dT = ΔS / ΔV The slope of the equilibrium curve will be positive if S and V both decrease or increase with increased T and P
Slope of Phase Reaction Boundaries dP/dT = ΔS / ΔV Reactants -Products Vice > Vlw -ΔV Sice < Slw +ΔS Reactants -Products Vlw < Vwv +ΔV Slw < Swv +ΔS
Variables • Extensive Variables – dependent on the amount of material present • mass • volume • moles of atoms • Intensive Variables – independent on the amount of material present • pressure • temperature • density • compositional proportions
Gibbs Phase Rule F = C – Φ + 2 F – number of degrees of freedom of intensive variables (p, t, x) that will still preserve chemical equilibrium C – number of components Φ – number of phases
One Component Phase Diagrams C Al2SiO5 Illustrate Polymorphism Isochemical P & T are intensive variables Phase Rules: divariant fields F=2 univariant lines F=1 invariant points F=0 SiO2 CaCO3
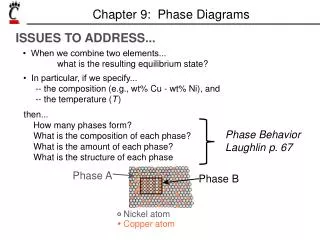
Two Component Phase Diagrams Solid Solution Crystallization Eutectic Crystallization • Usually portrayed as isobaric T-X diagrams • For igneous systems, magma/melt is a phase of a simplified composition defined by the mineral phases of interest • Liquidus – denotes the temperature at which the liquid of a particular compositions will begin to crystallize • Solidus denotes the temperature at which the liquid of a particular composition will be completely crystallized
Eutectic Crystallization of Anorthite (plagioclase) and Diopside (pyroxene) Eutectic Point Lever Rule Proportions Anorthite Diopside
Limited Solid Solution and Subsolidus Exsolution:e.g. Alkali Feldspar Increasing Pressure
Exsolution Textures Subsolidus Unmixing Pyroxene Hypersthene (Opx) exsolution lamellae in Augite (Cpx) host Alkali Feldspar Albite exsolution (perthite) in Microcline host
Multi-component Phase DiagramsIgneous Systems – Liquidus Diagrams Liquidus Surface Cotectic Lines Eutectic Point
Multi-component Phase DiagramsMetamorphic Systems Chemographic Diagramse.g. ACF A = Al2O3 +Fe2O3-Na2O-K2O C = CaO – 3.3P2O5 F = FeO + MgO + MnO Shows equilibrium assemblages at specified P & T Equilibrium assemblages in metabasalts
Next Lecture 50-minute Test on Crystal Chemistry Lectures 1-7 (see Powerpoints on Website) Klein Chapters 1 (p. 1-16), 3 (p. 38-103) and 4 (p. 107-131) See CD module 1 for help with ionic coordination Q & A in Lab on tomorrow (Tuesday)