Download
1 / 51
510 likes | 652 Views
SMU CSE 7315 Planning and Managing a Software Project. Module 21 Software Scheduling, Part 1. Objectives of This Module. To discuss how to estimate the length of a schedule To begin the discussion of how to develop a detailed schedule Basics of PERT charts. Source Information

E N D
SMU CSE 7315Planning and Managing a Software Project Module 21 Software Scheduling, Part 1
Objectives of This Module • To discuss how to estimate the length of a schedule • To begin the discussion of how to develop a detailed schedule • Basics of PERT charts
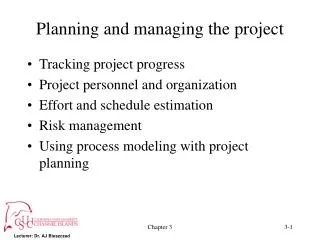
Source Information Statement of Work Requirements Constraints Standards Processes History etc. Estimate Size Estimate Effort and Cost WBS Size Effort & Cost Revise & Negotiate Not OK Estimate Schedule Complete Detailed Planning Evaluate Schedule OK Detailed Planning Process
Build Final Design Design Build Prototype Final Design Design Prototype Build Final Design Design Prototype Build Final Design Design Code Test Design Prototype Build Final Design Build Design Prototype Build Final Design Contract Delivery Design Prototype Build Final Design Design Prototype Build Final Design Design Build Prototype Final Design Design Prototype Levels of Schedule Detail • Top Level Project Schedule and Software Schedule • Generally produced during initial planning • Represented in the initial IMS for the project • Based on project constraints, deadlines, etc. • Focuses on • The major phases of software development • How software tasks relate to the rest of the project
Note about Generic Schedule(in estimating spreadsheet) • This is initially based on the top level software schedule, but can be refined based on later levels of schedule detail.
Levels of Schedule Detail (continued) • Intermediate Software Schedule • Generally produced during effort estimation, based on information gained from the estimating process • The focus is still on the major (high level) software phases and when they occur in time • But additional detail and refinement are generally included, such as working out iterative development plans or parallel development of major software components • Note that the IMS is typically updated as a result of this
Levels of Schedule Detail (continued) • More Detailed Schedules • Generally produced when you are about to execute the project or a phase of the project • The focus is on how and when you will do the detailed work tasks • Often results in detailed earned value planning (see later module) • IMS must be updated if major phases are shifted in time • But the additional details may or may not be added to the IMS
Test Development Set up Rqmts Deliver Test Design Code Evaluate Model Elaborate Refine Simulate Test Design Code Schedules are Developed in a Hierarchy Top Level SW Schedule Schedule for Design Phase Schedule for Simulate Task
Here We Will Cover Two Topics • How to verify that the top levels of the schedule are realistic • Normally this is done as part of the effort estimating process • How to develop a detailed schedule • This tends to be done when you are just about to begin a particular phase of development • But it can be done at a higher level for other purposes
Verifying that theSchedule is Reasonable How do you know whether the top level schedule is realistic? How do you determine schedule details? Two issues are of concern: • Total time to do the job • Percent of time and effort in each phase of the job
Total Time Needed • Total time needed to do the project is a direct factor of • Size and nature of software developed • Organizational capability • Process and methods • Time constraints • Financial constraints • This can vary significantly from one organization to the next
Estimating the Time Needed • Estimation models like Cocomo can be used to predict the length of the schedule • These models usually predict an ideal or optimal schedule • Each model bases its estimate on a particular set of assumptions, reflecting the experience of those who developed the model
Warning about Schedule Length Estimates • Most models and formulas for schedule length are based on someone else’s data and experience • All such data and experience are obsolete! • We have better tools, faster computers • We may have improved our process cycle time (see later module) • So we usually can do better than the schedules estimated by such models and formulas • Moreover, schedule length is flexible
Schedules Tend to beSomewhat Flexible • You can vary the actual schedule to fit your conditions • You have flexibility in matching the schedule to other project constraints • Cycle time improvement techniques can also improve your schedule • But you can drive up cost and risk as you deviate too far from the optimal
The Optimal Schedule... ... depends on people, process, nature of task, environment, etc. … • Until we have a better theoretical foundation, experience remains the best way of predicting your optimal schedule • Remember too that concerted efforts to reduce cycle time can improve your optimal schedule
Total Time to Do the JobCocomo Formula ... Schedule = 2.5 * Efforte e = .38 for organic .35 for semi-detached .32 for embedded Effort is measured in staff-months, as computed by the Cocomo formula (basic, intermediate, or detailed) Schedule is measured in calendar-months
Why is the Exponent Smaller for Embedded? • Note that the variable is EFFORT. • An embedded project of comparable size will have considerably more effort than a non-embedded project, thus the actual schedule will be longer, despite the formula.
Notes on Cocomo Formula Schedule = 2.5 * Efforte • This formula assumes schedule compression adjustment factor = 1 (nominal) • In other words, the schedule computed by the above Cocomo formula is an ideal schedule. • Yours is probably different.
Optimal Schedule staff-days required to do the work Calendar Time Allocated for the Work The Cocomo Model ofTime vs Effort
Beware of Circular Relationship • (ideal) schedule length is a function of effort in most models, including Cocomo • If your actual schedule is different from the ideal, then you must: • Change the “schedule compression” cost adjustment factor • Re-compute the effort (it should go up) • Do NOT re-compute schedule length as a function of effort, because the formula is no longer valid
Other Models Give Different Formulas for Time SLIM formula for TOTAL effort (lifetime): SLIM equation for development effort vs development time is slightly different: Size = Ck*Effort1/3*t4/3 So t4/3 = Size / Ck*Effort1/3) So t = (Size / Ck*Effort1/3))3/4 DE = Constant / Time4
RELATIVE EFFORT Putnam’s “SLIM”Time vs. Size Equation 18 16 14 12 • EFFORT = CONSTANT / TIME4 10 8 6 4 2 0 0.5 0.6 0.7 0.8 0.9 1 1.1 1.2 RELATIVE TIME
Why Do Models Vary on Schedule? • One reason is that schedules are flexible and you have some control over them. • Grady and Caswell compare 5 different sources (p34, 35) (see references) • Differences they identified stem from: • Type of software being developed • Schedule compression • Organizational differences • Process and methods
What to Do About Variation • Hewlett-Packard recommendations: • Measure actual data & keep for the future • Count everything (overtime, etc.) • Once you know YOUR organizational behavior, you can better calibrate the models to fit your experience
For Small Projects ... • General formulas tend to fit large projects better than small ones • And you may not have a good data base of historical schedule information ... • So it may be better to estimate the time in a more detailed manner, as will be shown later
Time May Require Adjustment • Your actual project may require a different amount of time than the “ideal” computed by the models or suggested by prior experience • Project constraints may also affect the schedule • You usually have a lot more flexibility with schedule than you do with size or cost
When Will Each Specific Task be Performed? • Many models will estimate this • Your past experience and your method of doing business are good guidelines • But initial estimates will seldom be precisely accurate for detailed tasks • Better accuracy requires developing a more detailed schedule • Which can also be used to give a more accurate estimate of the total time
Test Development Set up Rqmts Deliver Test Design Code Evaluate Model Elaborate Refine Simulate Test Design Code Schedules are Developed in a Hierarchy Top Level SW Schedule Schedule for Design Phase Schedule for Simulate Task
Scheduling Order • Generally you start with the top levelsoftware schedule from initial planning (the software part of the integrated master schedule) • Develop theintermediate schedule during the effort estimate, with a more detailed schedule for each of the major phases or tasks • The WBS serves as a guide • Very finely detailed schedules are best done just prior to performing the actual work
I need A detailed schedule! Tell me how long it Will take and when each task will be complete. Yes, sir! Right away, sir. What do I do now? Developing theDetailed Schedule
Information Needed to Develop an Effective Schedule • Desired start and completion dates • Other critical dates(reviews, interim milestones) • Process or lifecycle (major phases, milestones) • Tasks(organized by phase) • Control or review points • Task dependencies (which ones are sequential, which can be done in parallel) • Resourcesrequired for each task (personnel, skill levels, special equipment, etc.)
Techniques for Developing & Documenting a Detailed Schedule PERT Chart (PDM) • Shows dependencies and flow • Can expand to show timing and resources Critical Path (CPM) • Shows the longest path in the schedule GANTT Chart • Shows timing and parallelism Network Chart • Combines the benefits of PERT and GANTT • But you need a tool to manage
PERT “PERT” stands for “Program Evaluation and Review Technique” See Modell in reference list.
PERT Origins • PERT was developed in the 1940’s as a management tool for complex projects • In its fullest form, PERT involves complex statistical analysis of project schedules and plans
Task 8 Task 2 Task 5 Task 1 Task 3 Task 6 Task 7 Task 9 Task 4 PERT Charts • The basic tool of the PERT technique is the PERT Chart, which represents the schedule and resource needs of a project • The PERT chart uses the Precedence Diagramming Method (PDM), which is similar to a flow chart, to represent the dependencies among activities
A Minimal PERT Chart ... • Lists activities to be performed (from WBS) • Indicates dependencies • Activity X must precede activity Y, etc. • This information comes in part from initial planning (life cycle analysis, organizational planning, process definition, etc.)
Keyboard Design Prototype Final Design Build Keyboard Software Design Code Test Keyboard Emulation Build Subcontracted SW for Numeric Key Pad Contract Delivery Sample PERT Chart from Organizational Planning(in early planning steps) This can be produced by hand or with a project management or scheduling tool.
Steps of PERT Scheduling 1) Basic PERT -- task dependency and flow • shows dependencies, but not timing 2) More Complete PERT -- task duration • shows minimum schedule length 3) Critical path • shows what tasks contribute to minimum schedule length (what tasks need to be shortened to shorten the overall schedule) 4) Full PERT - resource requirements • shows manpower loading, resource needs, etc.
Task 8 Task 2 Task 5 Task 1 Task 3 Task 6 Task 7 Task 9 Task 4 Developing a PERT ChartStep 1 - Task Dependencies • List each task on a “post-it note” or index card • Lay out the tasks on a board • Indicate task dependencies with lines (arcs)
Code Test Verify Design Test Code Integrate Design Spec Develop Hardware Evaluating Dependencies
“Test” Task depends on “Code” and “Test Code” Code Test Verify Design Test Code Integrate Design Spec Develop Hardware Identifying Dependencies • What depends on what?
Code Test Verify Design Test Code Who needs this? (no successor) Integrate Design Spec Develop Hardware Identifying Dependencies • What dependencies are unknown?
Code Test Verify Design Test Code Integrate Design Spec External task that we depend on Develop Hardware Identifying Dependencies • What depends on what?
x y Task 5 Task 8 Task 2 6 3 Task 1 Task 3 Task 6 Task 7 Task 9 7 Task 4 Types of PERT Dependencies Finish to Start First task must finish before the second starts Start to Start Second task must start x months after first starts Finish to Finish Second task must finish y months after first finishes
Task 1 Task 2 Task 3 Task 5 Task 4 Task 2 Task 1 Task 3 Task 5 Task 4 Verifying Dependencies • Do not over-constrain -- use only the the essential dependencies • The following PERT chart represents a much more flexible plan With most PERT tools, you can specify a priority among parallel tasks
What to Learn from a Task Dependency PERT Chart • Identify dependencies you did not know existed • Identify missing dependencies where you do not know the successor or the predecessor • Identify critical dependencies, such as a hardware activity that will hold you up if it is late
Keyboard Design Prototype Final Design Build Keyboard Software Design Code Test Keyboard Emulation Build Subcontracted SW for Numeric Key Pad Contract Delivery NOTE PERT Charts are a good tool for developing a detailed process description as well as developing a project schedule
Module Summary • Optimal schedule depends on many factors unique to the project • Models can estimate this, but they are generally inaccurate and you have much flexibility • “Detailed” scheduling uses tools such as PERT, GANTT, and Network charts. • Basic PERT chart shows dependency & flow and can find many problems
References A Professional's Guide to Systems Analysis, Martin E. Modell, 2nd. Ed. McGraw Hill, 1996 U. of West Florida, PERT Home page, http://www.uwf.edu/~coehelp/studentaccounts/rnew/perthome.html