Download
1 / 21
210 likes | 211 Views
This research study examines the impact of population sustainability on two National Parks in the UK. It investigates the demographic characteristics, migration patterns, and policy implications of recent trends on local communities. The study highlights the need for affordable housing and strategies to retain young people within the parks.

E N D
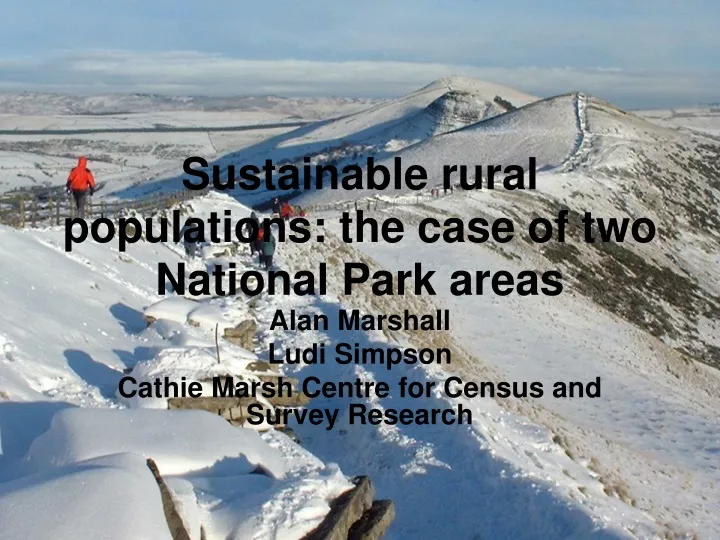
Sustainable rural populations: the case of two National Parkareas Alan Marshall Ludi Simpson Cathie Marsh Centre for Census and Survey Research
1.Introduction • Population sustainability is an important issue in National Parks in the UK • “If young people and key workers cannot afford to buy accommodation within park boundaries then local communities may suffer economic and social decline” (Cairncross et al, 2001)
1. Introduction • Population projections highlight the problem for policymakers • Research Questions: • If recent trends what will be the impact on the demographic characteristics of National Parks? • What is the nature of the migration age/sex profile in the two parks and its impact on population change? • What policy implications follow on from the projections?
2. National Parks in the UK • National parks in England and Wales were set up by the National Parks and Access to Countryside Act (1949) • Conservation of landscape • Promotion of public understanding and enjoyment of the special qualities of the Parks • Since 1995 - a duty to seek to foster the economic and social well-being of their local communities
2. National Parks in the UK • In Scotland National parks established in 2000 • A primary aim is the promotion of “sustainable economic and social development of the area's communities” • Tension between landscape conservation and social and economic well-being • Is there a need for more affordable housing?
2. National Parks Demographic characteristics • PDNP population: 38,000 • CNP population: 16,000 Compared with UK and surrounding districts: • Older • Predominantly white • Higher proportions of retired and self employed • Lower proportion of social housing • Smaller average household size • Higher proportions of holiday/second homes
3. Data and methodology • Standard population and household projection methods. Extended to labour force for PDNP • Population projections use the cohort component methodology • Age/sex headship and economic activity rates • POPGROUP projection software used to create projections. • Method requires very detailed data (single year of age and sex detail for each component)
3. Data and methodology Issues: Non standard boundaries • Estimation using proportions based upon residential addresses Small area estimation - Data availability and robustness of demographic rates • Use local data where possible to calibrate detailed schedules from relevant reference populations (wards, districts or national).
3. Data and methodology Population projections • Base population: • 2001 census (table CAS001) • Fertility and mortality: • GAD 2004 projections of age/sex specific fertility and mortality rates • Vital statistics (output areas): estimates of numbers of births and deaths in park areas (2001-4) • Migration: • age/sex schedule based on in and out migration in the year before the census
3. Data and methodology Household projections • DCLG projected headship rates - PDNP • GROS projected headship rates - CNP • Census 2001 park estimates of household numbers in each DCLG/GROS category Communal establishment population (Census 2001) Economic activity projections (PDNP only) • ONS projected economic activity rates • Census 2001 park estimates of numbers economically active
4. Results CNP population change between 2001-25 and CNP household change between 2001-16 All PDNP characteristics show change between 2001-26
2001 – 26% 60+ 2025 – 45% 60+
2001 – 26% 60+ 2026 – 49% 60+
4. Results: Migration profile In migration at older ages CNP +3645 (35-55) PDNP: +2457 (38-64 Out migration young adults CNP: -1570 PDNP: -7156 Net effect over all ages CNP: +4168 PDNP: +405
4. Results: PDNP - Zero net migration and Natural change projections
4. Results: Household projections • Relative to the population change number of households projected to increase • Elderly population more likely to live in single person households • Lower household sizes projected nationally
5. Discussion: Policy implications • Aging of population a real concern • Tackle the out migration 16-35 age range • Affordable housing • Attractiveness of the Park to the young • Further research – why are young people moving out?
Thank you! Any Questions/comments