Download
1 / 1
10 likes | 117 Views
Model-based approach for analysis of transcriptome perturbation reveals Ewing oncogene interaction Network. G. Stoll 1 , A. Zinovyev 1 , F. Tirode 2 , K. Laud-Duval 2 , O. Delattre 2 , E. Barillot 1 Service Bioinformatique, Institut Curie, Paris, France

E N D
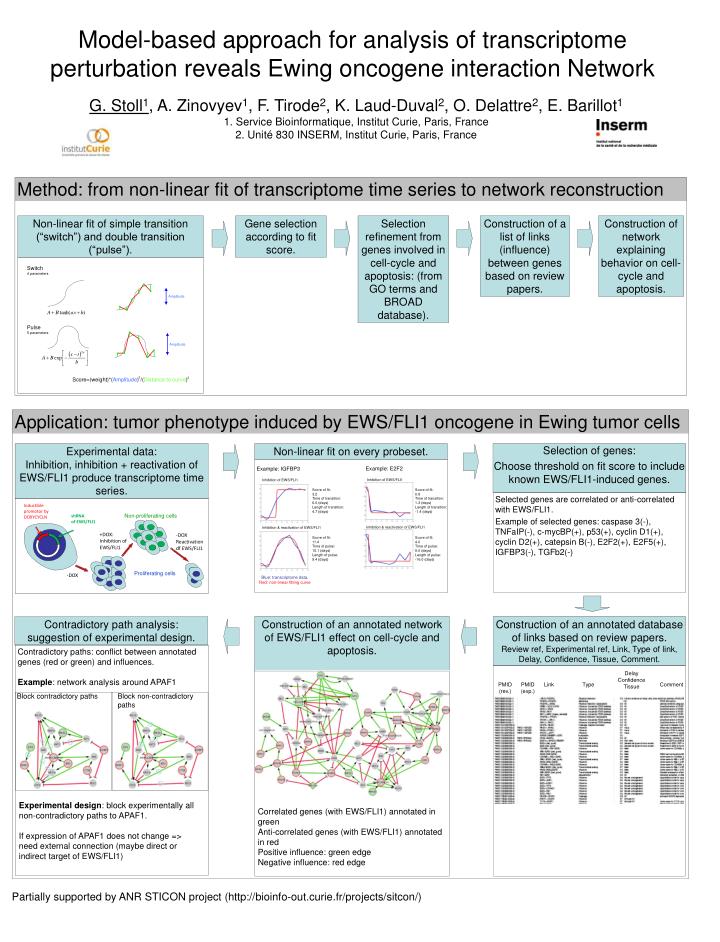
Model-based approach for analysis of transcriptome perturbation reveals Ewing oncogene interaction Network • G. Stoll1, A. Zinovyev1, F. Tirode2, K. Laud-Duval2, O. Delattre2, E. Barillot1 • Service Bioinformatique, Institut Curie, Paris, France • Unité 830 INSERM, Institut Curie, Paris, France Method: from non-linear fit of transcriptome time series to network reconstruction Non-linear fit of simple transition (“switch”) and double transition (“pulse”). Gene selection according to fit score. Selection refinement from genes involved in cell-cycle and apoptosis: (from GO terms and BROAD database). Construction of a list of links (influence) between genes based on review papers. Construction of network explaining behavior on cell-cycle and apoptosis. Switch 4 parameters Amplitude Pulse 5 parameters Amplitude 2 2 Score=(weight)*(Amplitude) /(Distance to curve) Application: tumor phenotype induced by EWS/FLI1 oncogene in Ewing tumor cells Experimental data: Inhibition, inhibition + reactivation of EWS/FLI1 produce transcriptome time series. Non-linear fit on every probeset. Selection of genes: Choose threshold on fit score to include known EWS/FLI1-induced genes. Example: E2F2 Example: IGFBP3 Inhibition of EWS/FLI1 Inhibition of EWS/FLI1 Score of fit: 3.2 Time of transition: 6.0 (days) Length of transition: 4.7 (days) Score of fit: 0.8 Time of transition: 1.3 (days) Length of transition: -1.4 (days) Selected genes are correlated or anti-correlated with EWS/FLI1. Example of selected genes: caspase 3(-), TNFaIP(-), c-mycBP(+), p53(+), cyclin D1(+), cyclin D2(+), catepsin B(-), E2F2(+), E2F5(+), IGFBP3(-), TGFb2(-) Inductible promotor by DOXYCYCLN Non-proliferating cells shRNA of EWS/FLI1 Inhibition & reactivation of EWS/FLI1 Inhibition & reactivation of EWS/FLI1 +DOX: Inhibition of EWS/FLI1 -DOX Reactivation df EWS/FLI1 Score of fit: 11.4 Time of pulse: 10.1 (days) Length of pulse: 9.4 (days) Score of fit: 4.0 Time of pulse: 9.0 (days) Length of pulse: -16.0 (days) Proliferating cells -DOX Blue: transcriptome data. Red: non-linear fitting curve Construction of an annotated network of EWS/FLI1 effect on cell-cycle and apoptosis. Construction of an annotated database of links based on review papers. Review ref, Experimental ref, Link, Type of link, Delay, Confidence, Tissue, Comment. Contradictory path analysis: suggestion of experimental design. Contradictory paths: conflict between annotated genes (red or green) and influences. Example: network analysis around APAF1 Delay Confidence Tissue PMID (rev.) PMID (exp.) Link Type Comment Block contradictory paths Block non-contradictory paths Experimental design: block experimentally all non-contradictory paths to APAF1. If expression of APAF1 does not change => need external connection (maybe direct or indirect target of EWS/FLI1) Correlated genes (with EWS/FLI1) annotated in green Anti-correlated genes (with EWS/FLI1) annotated in red Positive influence: green edge Negative influence: red edge Partially supported by ANR STICON project (http://bioinfo-out.curie.fr/projects/sitcon/)