Download
1 / 1
10 likes | 289 Views
Jennifer Cromley Nora Newcombe Ted Wills. Christine Massey. Temple University. University of Pennsylvania. Improving Diagrammatic Reasoning In Middle School Science Students. Abstract

E N D
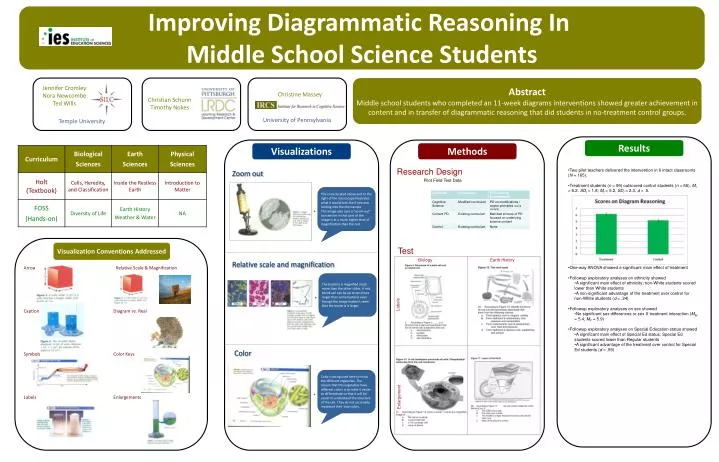
Jennifer Cromley Nora Newcombe Ted Wills Christine Massey Temple University University of Pennsylvania Improving Diagrammatic Reasoning In Middle School Science Students Abstract Middle school students who completed an 11-week diagrams interventions showed greater achievement in content and in transfer of diagrammatic reasoning that did students in no-treatment control groups. Christian Schunn Timothy Nokes Results Visualizations Methods Research Design • Two pilot teachers delivered the intervention in 6 intact classrooms (N = 165). • Treatment students (n = 99) outscored control students (n = 66), Mt = 6.2, SDt = 1.8; Mt = 5.2, SDt = 2.3, d = .5. • One-way ANOVA showed a significant main effect of treatment • Followup exploratory analyses on ethnicity showed • A significant main effect of ethnicity; non-White students scored lower than White students • A non-significant advantage of the treatment over control for non-White students (d = .24) • Followup exploratory analyses on sex showed • No significant sex differences or sex X treatment interaction (MM= 5.4, MF = 5.9) • Followup exploratory analyses on Special Education status showed • A significant main effect of Special Ed status; Special Ed students scored lower than Regular students • A significant advantage of the treatment over control for Special Ed students (d = .59) Zoom out Pilot Field Test Data The circle located above and to the right of the microscope illustrates what it would look like if one was looking into the microscope. This image also uses a “zoom-out” convention in that part of the image is at a much higher level of magnification than the rest. + Visualization Conventions Addressed Test Biology Earth History Relative scale and magnification Arrows Relative Scale & Magnification The bacteria is magnified much more than the other slides. A red blood cell can be up to ten times larger than some bacteria even though the image makes it seem that the bacteria is larger. + Labels Captions Diagram vs. Real Color Symbols Color Keys Color is being used here to show the different organelles. The reason that this organelles have different colors is to make it easier to differentiate so that it will be easier to understand the structure of the cell. They do not accurately represent their true colors. + Labels Enlargements Enlargement