Download
1 / 14
140 likes | 234 Views
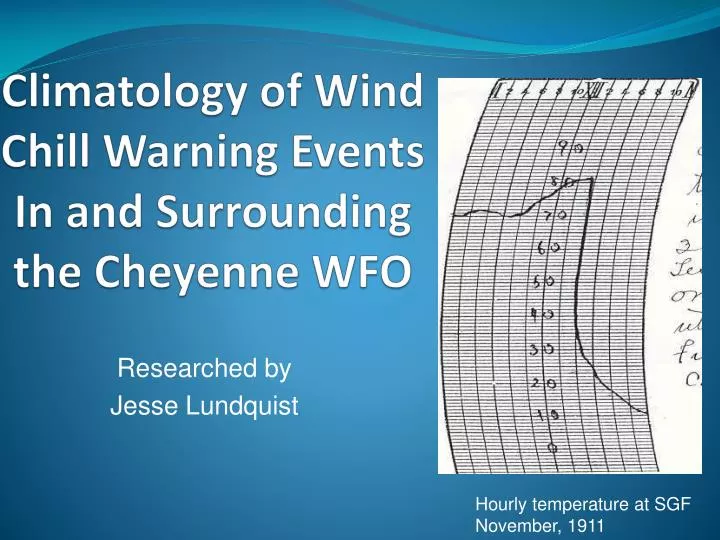
Climatology of Wind Chill Warning Events In and Surrounding the Cheyenne WFO. Researched by Jesse Lundquist. Hourly temperature at SGF November, 1911. Outline. Background Gathering the data Analyzing the data Current results Future work. From Earthweek : A Diary

E N D
Climatology of Wind Chill Warning Events In and Surrounding the Cheyenne WFO Researched by Jesse Lundquist Hourly temperature at SGF November, 1911
Outline • Background • Gathering the data • Analyzing the data • Current results • Future work From Earthweek: A Diary of the Planet website
Background • Temperatures are one of the most difficult variables to forecast • Terrain effects • Land cover • Cloud cover • Air mass interactions • Wind chill is highly important • Livestock • Safety From News Miner newspaper 2/2008
Background continued • Issued when wind chills become life threatening • Different offices, different criteria • Having a local climatology of wind chill warning events will help us better serve the public
Gathering data – site locations • Used NCDC hourly observations for CYS, BFF, LBF, UNR, CPR Rapid City 3202 ft. Casper 5319 ft. Scotts Bluff 3958 ft. North Platte 2800 ft. Cheyenne 6140 ft.
Gathering the data – site requirements • Had to be a “reasonable” amount of data available to be included in the study • Data had to go back to the early 1970s • LBF, CYS and BFF data went back to the 1940s • All of the sites had data gaps from the mid 1960s to the early to mid 1970s
Analyzing the data • Placed data in a spreadsheet • Used NWS formula for wind chill calculation • Windchill (ºF) = 35.74 + 0.6215T - 35.75(V0.16) + 0.4275T(V0.16) • Sorted the data according to wind chills at or below -30o F • Further sorted data according to wind speed • 0 MPH<windspeed<4 MPH, 4 MPH<=windspeed<9, windspeed>=10 MPH
Analyzing the data continued • Filtered data to only include observations with wind chills of – 30o F or colder • Separated data into events • Each event could be no shorter than 3 consecutive hours and be separated by at least 12 hours • Can now graph the data
Current results – data categorized by wind speed • Nearly all wind chill warning events have winds speeds equal or above 4 MPH, with the majority of winds at or above 10 MPH
Current results - duration • Despite location, majority of events tend to be 12 hours or less • Twice as likely to have a short event (12 hours or less)
Current results– events per year • More events in 1970s to mid 1980s and less after 2000 • Cycle in the climate
Future work • Compare climatology of each site to wind chill warnings that were issued for those areas • See how the office verified • Look at weather patterns for the longer events as well as a few of the shorter events • Have a better idea of the type of weather pattern set-up • Help get a handle on possible wind chill warnings sooner
Final Points • Will almost always have wind with an event • 2/3s of the time wind will be at or above 10 MPH • Twice as likely to have an event only last up to 12 hours • Fewer events after the year 2000