Download
1 / 13
130 likes | 264 Views
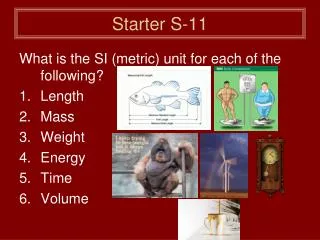
Science Starter! Perform the following conversions and dimensional analysis problems. Reflect your answer in scientific notation. 30 in mm 12 cm mi 50 mi/hr m/s 25 ft /s cm/ hr. Graphing Basics. Parts of a Graph. “Best Fit” Line.

E N D
Science Starter! Perform the following conversions and dimensional analysis problems. Reflect your answer in scientific notation. 30 in mm 12 cm mi 50 mi/hr m/s 25 ft/s cm/hr
Parts of a Graph “Best Fit” Line Variable that is measured during an experiment (y - axis) Variable that is controlled in an experiment (x - axis)
Distinguishing Variables Example: I worked for 5 hours and made $50. Independent: What did YOU directly control (do)? 5 hours Dependent: What happened because of your action (measure)? made $50 EXCEPTION: TIME is always considered an independent variable, even though it may be the quantity measured.
Types of Relationships LINEAR - Straight line - Equation: y = mx + b - Direct Relationship Slope [Steepness of line] = (Y2 – Y1) or RISE (X2 – X1) RUN
Graphing Data Data Chart - Determine the independent and dependent variables Plot Data - Place a dot at the intersection of the two variables
Calculating Slope • Choose any two points on the line of best fit: • (not data points)EX: ( y = 15, x = 30) and ( y = 0, x = 0) • Calculate slope by dividing the difference in the “y” values by the difference in the “x” values: • EX: Slope = (15 – 0) • (30 – 0) • Slope = 0.5
Enclosed Area • Shade in the region in question: • EX: Find the area enclosed by the line of best fit and the horizontal axis between x = 0 and x = 30. • Use geometry and the values on the axis (NOT number of blocks) to find the area of the shape made. • EX: A = ½ bh • = ½ (30)(15) = 225
Area = ½ bh = ( ½ )(6)(14.5) = 43.5