Download
1 / 122
1.22k likes | 1.24k Views
Supply Chain Management Lecturing SS 2011. helmut.merkel@prologue-asia-pacific.com. Supply Chain Management. Why Supply Chain Management ? 1 .1. Learning Curve Concept 1.2 Innovation 1.3 Specialization , Globalization , Cooperation 2. Supply Chain Model

E N D
Supply Chain ManagementLecturing SS 2011 helmut.merkel@prologue-asia-pacific.com
Supply Chain Management • Why Supply Chain Management ? • 1.1. Learning CurveConcept • 1.2 Innovation • 1.3 Specialization, Globalization, Cooperation • 2. Supply Chain Model • SCOR, DCOR, CCOR of the International Supply Chain Council • 3. Communication Architectures • 3.1 The Marathon Principle • 3.2 The Domino Principle • 3.3 The Shared Information Principle • 3.4 The Architecture behind • Design Principles • 4.1 “Vision” of the entire Process Chain • 4.2 Company overlapping Process Design (Vision of the entire Process Chain) • 4.3 Decision Making - Feedback Loops as basic Process Elements • 4.4 Self-Similarity – the Formula for Growth • 4.5 Shared Information Communication Architecture • 4.6.Central- or decentralized control of Supply Chains ?
Supply Chain Management (2) • Implementation • 5.1. Top Down Approach • 5.2 Business Re-engeneering • 5.3 Aris Business Process Modelling • 5.4 Business Process Modelling and Project • Management • Total Cost of Ownership • 6.1 How to calculate Implementation Projects ? • 6.2 Cost Curve Models • 6.3 Total Cost of Ownership – Approach
1. Why Supply Chain Management 1.1. Learning Curve Concept 1.2 Innovation 1.3 Specialization, Globalization, Cooperation
1.1 The Learning Curve Model In competition an individual company has to proof its advanced learning curve, which leads to competitive advantages, before at all to improved “Total Costs per Unit” (Gesamtstückkosten) costs per unit (c/u) Unit price (1) In a world with fixed terms, the first movers are always on the save side Unit price (2) Company B Company A 5 Output(0) Accumulated Volume
1.1 The Learning Curve Model The Learning Curve “Theory” was heavily researched in the 1970’s – Economies of Scale, Economies of Scope etc. costs per unit (c/u) Division of Labor and all kind of specialization are the reason to discuss related “Transaction costs” Accumulated Output Volume
in the real world, many things can be changed Costs per Unit Transaction Costs Total Costs per Unit Innovation Re-Engineering Specialization Globalization Horizontal Cooperation in Theory ! Vertical Cooperation -
1.3 Innovation is „Change“ - How does „Change“ work ? Product Innovation, Business Model Innovation, Process Innovation and Infrastructural Innovation impact each other Costs per unit (c/u) can be significantly impacted by“Innovation” – the learning curve model shows the details Innovation also triggers “Productivity” and “Structure” – i.e. productivity advantages and structural advantages Innovation Structural Change (horizontal and vertical Cooperation) (Re-Engineering, Specialization, Globalization)
1.2 Innovation is Change „the destructive power in the struggle for the better“ “Innovation” in 1870 (Schumpeter): • - Introduction of a new product or a new quality of an existing product • - Implementation of a new production system in an industry (…to improve costs per unit (cpu)) • - A new sales-/distribution channel • Discovery of a new source for raw material or product components • Implementation of a new organization
1.2 Innovation is „Change“ - How does „Change“ work ? Business Modell Business Process Systems/Infrastructure Operations Tactics Strategy Business Model Business Model Business Process Business Process Systems/Infrastructure Systems/Infrastructure
1.2 Innovation is „Change“ - How does „Change“ work ? Business Model Process Model Process Model Systems/ Infrastructure
Business Model Gesch ä ftsmodell Gesch ä ftsmodell Gesch ä ftsmodell Process Model Gesch ä ftsprozesse Gesch ä ftsprozesse Gesch ä ftsprozesse Systems/Infrastructure Informationssysteme Informationssysteme Informationssysteme Gesch ä ftsmodell Gesch ä ftsmodell Gesch ä ftsprozesse Gesch ä ftsprozesse Informationssysteme Informationssysteme 1.3 Innovation is „Change“ - How does „Change“ work ? Idea Product Innovation Idea Idea Process Innovation Systems Innovation Idea
1.3 Innovation reduces Costs per Unit Innovation c/u The assumption, c/u are shifted in parallel, implies the same process integration level. change of the transaction costs posssible Innovation lowers c/u Same Volume Accumulated Volume
1.3 Innovation is „Change“ - How does „Change“ work ? In economies with an increasing degree of specialization, communications and logistics transactions are rapidly growing. Infrastructure: ports, airports, highways telecommunication and education are becoming key success factors in an economy. Additional elements, additional relations The car manufacturers reduced their own share of production from 70% in 1970 to only 17 % in 2005
1. 1. 2. 2. 1.3 Specialization lowers the Costs per Unit Specialization/Division of Labor (sharing of work) Cost per unit c/u The assumption, c/u and transaction costs are shifted in parallel, implies the same process integration level. Supply Chain Management has to control Transaction Costs. The increase in “Transaction costs” must be lower then the decrease of the “Costs per Unit”. … but increases transaction costs Sepicialization reduces C/U Accumulated Output Same output
1. 1. 2. 2. 1.3 Globalization lowers the Costs per Unit Globalization Cost per unit c/u The assumption, c/u and transaction costs are shifted in parallel, implies the same process integration level. Supply Chain Management has to control Transaction Costs. The increase in “Transaction costs” must be lower then the decrease of the “Costs per Unit”. … but increases transaction costs Globalization reduces C/U Accumulated Output Same output
1. 1. 2. 2. 1.3 Horizontal Cooperation lowers the Costs per Unit (horizontal) Cooperation/Concentration Cost per unit c/u The assumption, c/u and transaction costs are shifted in parallel, implies the same process integration level. … but increases transaction costs Supply Chain Management has to control Transaction Costs. The increase in “Transaction costs” must be lower then the decrease of the “Costs per Unit”. Cooperation reduces C/U Accumulated Output Increasing Output
1. 2. 1. 1.3 Vertical Cooperation changes Transaction Costs (vertical) Cooperation/Concentration Cost per unit c/u The assumption, c/u and transaction costs are shifted in parallel, imply a higher process integration level. Supply Chain Management has to control Transaction Costs. The decrease in “Transaction costs” will lower the overall “Costs per Unit”. … but decreases transaction costs Accumulated Output Same Output
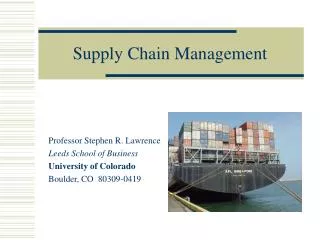
2. Supply Chain Model The leading “Supply Chain Reference Model” from the international Supply Chain Council, 2005-2007: SCOR; DCOR and CCOR What is a Supply Chain ? A supply chain is a well organized Process to serve and supply a specific market, using global resources and global logistics infrastructure, IT systems, human skills etc. Competition in all markets force companies to develop time to market advantages, flexibility abilities as well as competitive “Costs per Unit” (Stückkosten). The Supply Chain Operations Reference Model (source: Supply Chain Council, 2005a)
2. Supply Chain Model „Vision“ of the entire Process Chain Push: SCOR/TOGAF The Supply Chain Operations Reference Model (source: Supply Chain Council, 2005a)
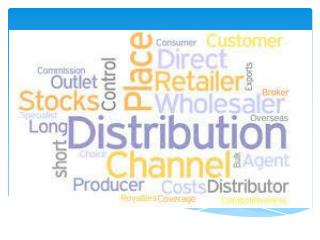
2. Supply Chain Model Design Process Product Development Sampling Order placement Inline Production Packaging Sourcing Consolidation Quality Checks Booking Document Handling Transportation Importmanagement Haulage Distribution Centre/Crossdock Distribution Storelogistics Focus: Product Management Overlapping processes not covered !!! Supplier/Vendor Management Quality Management Risc Management (ISO 28000) Finance missing Focus: Buying, Sourcing Focus: Logistics, Supply Chain Management
3. Communication Architectures 3.1 Marathon Principle 3.2 Domino Principle 3.3 Shared Information Principle 3.4 The Architecture behind
3. Communication Architectures What is a Supply Chain ? A supply chain is a well organized Process to serve and supply a specific market, using global resources and global logistics infrastructure, IT systems, human skills etc. Competition in all markets force companies to develop time to market advantages as well as “cost per unit” (Stückkosten) advantages. The key to gain time and cost advantages is the Process Design of a Supply Chain. The key of Process Design is the “Communication Architecture”. The Communication Achitecture describes how regular communication between hundreds of participants of a Supply Chain is organized. How are “order information” forwarded ? Who has actual information ? How are Exceptions (Alerts) organized etc. ?
3. Communication Architectures 3.1 Marathon Principle – Trigger concept Phidippides or Pheidippides (or Philippides) 570 bC., when the Persians (Darius I) landed at Marathon, was send by the Athenians to Sparta as fast as possible he can, to ask for help. The Spartans said that they will help after the moon was full (probably in order to let the Athenians alone with the Persians and not only for religious reasons). Phidippides came back running the 147 miles distance with the disappointing news for the Athenians. Phidippides then returned to Marathon in time to fight in the battle. He was ordered to run to Athens to bring the news of victory. In one week he had to run more than 300 miles.
3. Communication Architectures 3.2 The Domino- or Chinese Wall Principle 221 bC, Qin Shi Huang completed the first part of the Chinese wall, to protect “Zhong Guo” against the Barbarians. Whenever the wall was attacked, a fire was set up on the nearest watch tower – and all other watch towers followed to do the same. So the message of an attack was much faster then a messenger.
Order Order Order-Status Confirmation Order Information Store Allocation Coordination of Orders Shippment information Order Information Ex-Factory Date Sales Report Arrival Date Shippment Advice 3.2 The Domino Principle Even in 2010, many companies organize their process after the „Domino Principle“ Manufacturer Product Mgmt Agent „Pier to Pier” Information flow (Domino Principle) Distribution Centre Store Consolidation Hub
Order Label Order Order Production Confec- tion Order Production Haulage Docu- ments Shipment Haulage Fax QC Distribution 3. 2 The Domino Principle Even in 2010, many companies organize their BPR after the „Domino Principle“ Buying Agent Vendor Manufacturer Forwarding Agent Carrier Holage Agent Price competition, Time Pressure, Need forFlexibility … the Domino Principleis obsolete QC Cross Docking Store Sales
3.3 Shared Information Principle This principle was developed by “nature”. All geese watch the top goose ahead and not their direct predecessor. What would happen, if they all follow only their direct predecessor ?
Database IT-based Information In Advance Information- Control- Order, Labels, Pkcklist, QC Product Managmt System Production Manufacturer Pre-Supplier Production Transpor- tation Forwarding Agent Shippment Carrier Haulage Transportation Agent Distribution Distribution Centre Sales Store 3.3 The Shared Information Principle Information in advance (SharedInformation Services) saves time, costsandincreasesflexibilityof all involvedparties ... Same process structure for QC, AZO etc.
Agent Manufacturer Buyer Consolidation Bypass Conditioner Store Carrier Cross Docking 3.3 The Shared Information Principle Paradigm Shift: The Shared Information Principle QC WWW Database
3. Communication Architectures 3.4 The Architecture behind 3.4.1 Feed back loop Model, Feed forward Model, Growth Model – Definition of “System, Structure, Behavior (Performance), Process”, Second order System 3.4.2 Connecting “Feed back loop Models” as a Domino Chain 3.4.3 Connecting “Feed back loop Models” with a Shared Information Hub 3.4.4 Exchanging Capacity Information 3.4.5 Matching “goals” 3.4.6 Merging loops to avoid redundant functions 3.4.7 Forced self-similarity
3.4 The Architecture behind 3.4.1 Feed-back-loop Model (first order, linear system) Plan: replenish bucket until line (Ziel) Plan Control Feed Back Manage Report “gap” Watch process realtime and measure “gap” (target-level) Open water tap
Ressourcen - First Order Control Loop Target 3.4 The Architecture behind 3.4.1 Feed-back-loop Model (first order, linear system) Manage Plan Control Control Feed Back Feed Back Manage Plan Plan Control Feed Back Manage
3.4 The Architecture behind System: Set of elements and relations := S e1, e2, e3, … en; r1, r2, r3, … rn, r11, r12, rnm The “e’s” are elements, the “r’s” are relations. Relations are connecting elements. Elements perform “Functions”. Relations can be information-, energy-, materials- moneyflow etc. The Structure of a system is a frozen picture of all elements and connections in a one moment. Behavior of a system is the measurable performance of a system during a period of time. All Systems serve a purpose – they are following a target. A target can have several sub-targets. In nature the central target of a system is survival, and improving living conditions. Living conditions can only be improved, if the usage of the systems resources is efficient. To follow a target, systems use the Functions of their elements. Using the functions, is using up limited resources. The limitation of resources determines the capacity of an element. In order to reach a specific target (sub-target), the usage of the functions has to be coordinated. Coordination means, to organize the sequential or parallel use of all functions (i.e. resources) efficiently. Efficient means: to reach a given target with a minimum use of resources; or: to reach the best level (maximum) of a target with given resources.
3.4 The Architecture behind Performance of a system is the measurable behavior of a system during a period of time. Performance has to be defined in relation to the given targets. If the target is a quantity, for example: “efficient production of 1000 units in one month”, an adequate performance measuring would focus on the progress of production during the period of time and on the cost level to measure “efficiency”. Performance measurement can be a complex task, because sub-targets have to be measured and the functions of many elements have to be observed. Therefore we use so called: KPI Systems. An intelligent set of all Key Performance Indicators. Process is an expression, which is widely used in all areas of Science and Practice. We define “Process” as “System”. A Process is a System …. • Live systems in Nature have five basic process patterns: • All processes to build up a living infrastructure • All processes to maintain survival levels • All processes to expand living conditions for growing populataions • All processes to overcome emergency (Exceptions) situations • All processes to recover and come back to normal survival levels
3.4 The Architecture behind „Feed Forward Model“ (Steuerung) Decision: 1(l)/0.1 (l/sec) = 10 sec. water flow Plan Control Check pressure and capacity of the water tap Plan: 1(l)/0,1 (l/sec) 10 seconds water flow Manage Feed Back, after the entire process is completed Target: Fill the bucket with 1 l water ! There is no water in the bucket now. Manage
3.4 The Architecture behind „Growth“
3.4 The Architecture behind Second „order“ system A Supply Chain is at least a “second order system” or a “higher order system”. The self similar loops represent legal independent companies, with intedpendent goals/targets and non transparent capacities for the participants. From a birds perspective, there are multiple redundant functions (like planning/decision making). The communication between the different loops is “Domino like” – Every loop puts a Purchase Order (PO) to the predecessor loop. The predecessor is delivering what is requested in the PO, according to the terms of the PO. According to the terms, the payment is arranged after the same terms. Goal Goal
Higher Order Control • Loop Target Time 3.4 The Architecture behind 3.4.2 Connecting “Feed back loop Models” as a Domino Chain A Value Chain as higher order system with Domino connected decision loops is not efficient … The Inefficiency is Delta “R, Ressources” and Detlat “T, Time” This (delayed) behavior results from the design of the “communication architecture” What are the “natural reasons” of R and T delays in the real world R The “mathematics” behind is a (linear) differential equation model of higher order T
3.4 The Architecture behind 3.4.2 Connecting “Feed back loop Models” as a Domino Chain 1. 1. 1. 1. 2. 2. 2. 2. Goal Goal Goal The reasons for „Inefficiency“ in Domino connected Supply Chains are: • - No exchange of “capacity” information/restrictions (walking bottle neck…) • No procedure to match “goals” • No exchange of information about critical process situations (exception management) • Redundant functions • No forced self-similarity
Insufficient Communication Shared Information – Instead of Domino Architecture 3.4 The Architecture behind 3.4.2 Connecting “Feed back loop Models” as a Domino Chain Non synchronizedcapacityof Ressources; bottle-necks (Oliver Wight) MRP, MRP II, ERP, SC(R)M Non synchronized„goalsortargets“ – RedundancyofFunctions Reduce Complexity – merge Loops („Bullwhip-Effekt“) Consequent closed-loop Architecture self-similarity Lacking control of „critical“ Developments – missing feedback links Quality of Information Standardization
3.4 The Architecture behind 3.4.3 Connecting “Feed back loop Models” with a Shared Information Hub … only the “Shared Information” Architecture allows an efficient operation
3.4 The Architecture behind 3.4.3 Connecting “Feed back loop Models” with a Shared Information Hub
3.4 The Architecture behind 3.4.6 Merging loops to avoid redundant functions Goal In Supply Chains the successors and predecessors can agree to merge multiple functions to avoid redundancy …
Understand, Plan Control Feed Back Buy/Source, Move, Sell, Pay 3.4 The Architecture behind 3.4.7 Forced self similarity The Process Design is following the “control loop” principles, which is supported by adequate Systems infrastructure (IT-Systems, Logistics) Operations Tactics Strategy Business Modell Business Process Systems/Infrastructure