Download
1 / 30
300 likes | 690 Views
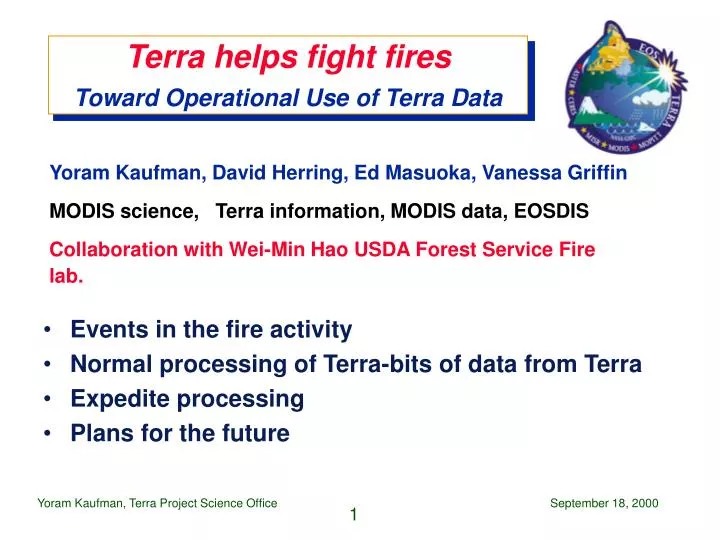
Terra helps fight fires Toward Operational Use of Terra Data Events in the fire activity Normal processing of Terra-bits of data from Terra Expedite processing Plans for the future Yoram Kaufman, David Herring, Ed Masuoka, Vanessa Griffin

E N D
Terra helps fight firesToward Operational Use of Terra Data • Events in the fire activity • Normal processing of Terra-bits of data from Terra • Expedite processing • Plans for the future Yoram Kaufman, David Herring, Ed Masuoka, Vanessa Griffin MODIS science, Terra information, MODIS data,EOSDIS Collaboration with Wei-Min Hao USDA Forest Service Fire lab.
Toward Operational Use of Terra Data • On Aug. 28, there were 26 wildfires in Montana, 23 in Idaho • Several fires converged into one very large fire • Wei Min Hao predicted fires will burn another 3 weeks • Clinton declares parts of those states ‘disaster areas’ on Aug. 29-30 • On Aug. 29, we asks EOSDIS for operational turnaround of MODIS images over those states • Goal is to push images to Forest Service by 12 noon the day after acquisition • Pursued 5 paths to Level 1b, 5 paths to making images SCIENCE MODIS SDST EOSDIS/GDAAC Yoram Kaufman (Terra PSO) • Ed Masuoka (SDST) • Vanessa Griffin (DAACs)David Herring Nazmi El Saleous Steve Kempler (GDAAC) Reto Stockli Jack Shol Chris Lynnes (GDAAC) Rong Rong Li (MODIS) Kay Spreitzer (NOAA) Brian Montgomery
MODIS Data System Performance (mid-August) Data at L2 in MODAPS Raw data to EDOS Data at L1b in GDAAC Data at L0 in GDAAC < 24 hours < 2 hours 2 - 4 days, or more 3-5 days, or more On average, data takes a day in EDOS, a day in GDAAC, and a day in MODAPS to reach L2 or higher. But this depends upon the granule of data. Some granules are missing from EDOS, which are eventually available but move more slowly through the system. The process for making images for public release was taking 7 to 10 days.
Days 153 - 160 (June 8-15) Incomplete data coverage hampers the ability to produce 8-day, 16-day, & 30-day composites. This hampers ability to detect large climate & change trends. By MODIS SDST
Relatively Little Springtime Snow cover in N. America This early MODIS 8-day composite from March 5-12 shows much less snow cover when compared to the averages for February (yellow line) and March (red line). The lack of snow contributed to near-record low water levels in the Great Lakes and dry soils, a precursor for an active wildfire season, Posted mid-April on the earthobservatory.nasa.gov. By Dorothy Hall, et al.
TRMM CERES Outgoing Longwave Rad. Anomalies Is OLR Anomaly a 10-day precursor to the drought? Note the low values off west coast & high values over Gulf of Mexico & southeastern U.S. By Tak Wong
Drought in the Rockies NDVI anomaly for July 2000 in North America, (NOAA AVHRR). Dry conditions in the western U.S. Western Montana & eastern Idaho appear darker brown. By Jim Tucker and Rob Simmon MODIS’ Enhance Vegetation Index product will be superior to AVHRR’s NDVI, both in terms of spatial and spectral information, but there are currently too many gaps in the data archive to derive monthly composites.
MODIS Water Vapor over N. America- Day 110 (April 12)( blue - dry; red - wet ) By Bo-Cai Gao Yoram Kaufman and Rong Rong Li
MISR Smoke Plumes Day 218 Acquired Aug. 5, Released Aug. 16 MISR true-color image of land surface and smoke over Montana & Idaho By MISR Science Team
Image by Landsat 7 Day 227 Acquired Aug. 14, 2000 Released Aug. 20 Bitterroot National Forest, Montana, About 30 large blazes across Montana had burned more than 600,000 acres (937 square miles). Dark red - recent burn scars, bright red - flaming fires, Blue- smoke By Rich Irish, Landsat 7 Team
MODIS Direct Broadcast Day 233 Acquired Aug. 20 Produced Aug. 21 MODIS direct broadcast data over fires in Montana & Idaho By Liam Gumley, U. of Wisconsin
Rapid Response Team’s First MODIS Image over Montana using EOSDIS Day 234 Acquired Aug. 21 Produced Aug. 29 57 fires were burning; true-color image of wide-spread smoke over Montana (thermal channel were watching the moon - calibration ) By Reto Stockli
Two MISR Perspectives on the Smoke Plumes in Montana Acquired August 14 Released August 30 left - view from MISR nadir camera right - view from 60° forward angle, showing better the smoke location and extent. A brown burn scar is located nearly in the exact center of the nadir image, while in the high-angle view it is shrouded in smoke. By MISR Science Team
MODIS detects Fires! Day 236 Acquired Aug. 23 Produced Aug. 30 True-color image of smoke & burn scars over Montana fire pixels added using 3.75 µm channel By Rong Rong Li
MODIS vs. AERONET Aerosol Optical Thickness - land At 0.47 m At 0.66 m r = 0.91 r = 0.86 MODIS MODIS y = 0.89 x + 0.05 y = 0.95 x - 0.004 Sun photometer Sun photometer Total points = 115 Note: excluding Venice, El Arenosillo, Wallaps, MD Science Center, GSFC sites Allen Chu and Yoram Kaufman MODIS can quantify the smoke concentration
MOPITT Carbon Monoxide Aug. 22-27, 2000 Composite image showing unvalidated levels of carbon monoxide over Montana & Idaho. By David Edwards, NCAR
Five Paths to Operational MODIS Level 1b Data MODIS Direct Broadcast data Raw data to EDOS < 2 hours W/in seconds Data to NOAA via “bent pipe” Data at L0 in GDAAC L0 data in rec. station ~ 8-10 hours ~ 2 hours < 1 hour Data at L1b in MODAPS Fast response processes to L1b L1b ready at NOAA Data at L1b in GDAAC L1b data in rec. station ~ 12-14 hours ~ 12-14 hours ~ 4 hrs ~ 2 hours ~ 12-24 hrs
5 Paths to Images • Nazmi El Saleous, MODLAND Group • Rong Rong Li, Atmosphere Group • Reto Stockli, Earth Observatory Team • Based in Switzerland, 6 hours ahead • Rob Simmon, Earth Observatory Team • Brian Montgomery, Rapid Response
Fires in Idaho - MODIS Day 243 Acquired Aug. 30 Produced Aug. 31 Fire pixels, smoke, clouds, & land surface in Idaho By Nazmi El Saleous
Clouds! (& fires) - MODIS Day 244 Acquired Aug. 31 Produced Sept. 1 True-color image of clouds, smoke, fires, & burn scars over Montana By Rong Rong Li
Break in the Clouds, few fires Day 245 Acquired Sept. 1 Produced Sept. 2 True-color image of clouds, smoke, & fires over Montana By Rong Rong Li
Day 247 - Small Fires Visible Acquired Sept. 3 Produced Sept. 4 By Rong Rong Li
Clouds, No Fires Day 250 Acquired Sept. 6 Produced Sept. 7 True-color land and clouds over western North America, with state boundaries By Rong Rong Li
MODIS vs. AVHRR fires in Idaho Ch 20 saturates at 330K, Ch 21 saturates at 450K thus shows the location of the fire fronts (red) By Rong Rong Li and Yoram Kaufman
MODIS vs. AVHRR fires in Idaho The MODIS images in the previous slide were acquired on Aug. 23 over Montana and Idaho. Each image is 60 by 60 pixels and a single pixel is 1 square kilometer. The image on the left was made using MODIS' channel 20 (centered at 3.7 µm); this image approximates the capability of the NOAA Advanced Very High Resolution Radiometer (AVHRR) to detect fires and measure their intensities. The image on the right uses MODIS' channel 21 (centered at 3.90 µm). Notice how MODIS channel 21 shows greater sensitivity to the temperatures of the fires, which can help fire scientists pinpoint where there are active flaming fires and where fires are less intense or smoldering. This is important because large smoldering fires can contribute heavy amounts of pollutants into the atmosphere, while active flaming fires are often where firefighters concentrate their efforts for containment and suppression.
Burn Scars Day 251 Produced Sept. 7 -- 24-hour turnaround False-color image over Montana & Idaho. Burn scars appear as dark purple splotches. By Rong Rong Li
Conclusions • The Terra Rapid Response Team succeeded in outputting useful products to the Forest Service • The goal of 24-hour turnaround was achieved • The potential for operational use of MODIS direct broadcast was demonstrated • Wei Min Hao submitted 5-year, $.5 million per year proposal to Forest Service for MODIS DB station for fire monitoring • The Rapid Response Team will continue to explore working relationships for operational use of data: • USDA Forest Service • U.S. Army Corps of Engineers • World Health Organization • NOAA