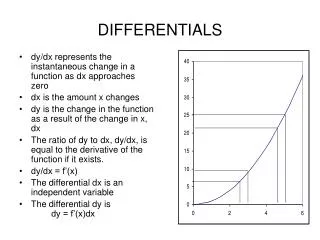
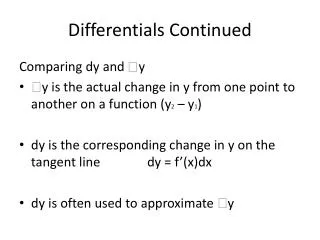
Download
1 / 96
960 likes | 1.28k Views
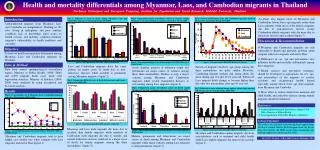
Ethnic Differentials in Mortality. Based on the Study of Ethnic Differentials in Adult Mortality in Central Asia. Michel Guillot (PI), University of Wisconsin-Madison Natalia Gavrilova, University of Chicago Tetyana Pudrovska, University of Wisconsin-Madison. Background on Kyrgyzstan.

E N D
Based on the Study of Ethnic Differentials in Adult Mortality in Central Asia Michel Guillot (PI), University of Wisconsin-Madison Natalia Gavrilova, University of Chicago Tetyana Pudrovska, University of Wisconsin-Madison
Background on Kyrgyzstan • Former Soviet republic; became independent in 1991 • Population: 5.2 million (2006) • Experienced a severe economic depression after break-up of Soviet Union • GNI per capita = 440 USD; 28th poorest country in the world (2005) • 48% of population below national poverty line (2001)
Ethnic Groups in Kyrgyzstan • Native Central Asian groups: Kazakh, Kyrgyz, Tajik, Turkmen, Uzbek (Sunni Muslims) • Slavs: Russian, Ukrainian, Bielorussian • Kyrgyzstan, 1999 census: • Central Asians: 79% of pop. (Kyrgyz 65%) • Slavs: 14% of pop. (Russian 12%)
Mortality paradox? • Soviet period: Russians/Slavs occupied dominant positions in the socio-economic structure of Central Asian societies (Kahn 1993)
Mortality paradox? • Slavic females more educated than Central Asian females (1989 and 1999 censuses) • Slavic males: educational advantage not so clear – varies by age (1989 and 1999 censuses) • Slavic households less poor than Central Asians (1993 World Bank poverty survey) • Infant mortality lower among Slavs (Soviet and post-Soviet period)
Proportion of individuals with post-secondary education, by age and ethnicity, in 1989 census. Females
Mortality paradox? • Slavic females more educated than Central Asian females (1989 and 1999 censuses) • Slavic males: educational advantage not so clear – varies by age (1989 and 1999 censuses) • Slavic households less poor than Central Asians (1993 World Bank poverty survey) • Infant mortality lower among Slavs (Soviet and post-Soviet period)
Proportion of individuals with post-secondary education, by age and ethnicity, in 1989 census. Males.
Mortality paradox? • Slavic females more educated than Central Asian females (1989 and 1999 censuses) • Slavic males: educational advantage not so clear – varies by age (1989 and 1999 censuses) • Slavic households less poor than Central Asians (1993 World Bank poverty survey) • Infant mortality lower among Slavs (Soviet and post-Soviet period)
Mortality paradox? • Slavic females more educated than Central Asian females (1989 and 1999 censuses) • Slavic males: educational advantage not so clear – varies by age (1989 and 1999 censuses) • Slavic households less poor than Central Asians (1993 World Bank poverty survey) • Infant mortality lower among Slavs (Soviet and post-Soviet period)
Data • Unpublished population and death tabulations since 1959 • collected from local archives • Individual census records – 1999 • Individual death records – 1998-1999 • obtained from national statistical office
Possible explanations for mortality paradox • Data artifacts • Migration effects (esp. 1989-99) • Cultural effects
Data artifacts? • Could the lower recorded mortality among Central Asian adults be due to lower data quality among them (coverage of deaths, age misreporting)?
Cultural effects? • Culture may affect mortality in various ways: • individual health and lifestyle behaviors (e.g., diet, smoking, alcohol, use of preventive care) • family structure and social networks (denser social networks may produce lower stress levels and better health) • Could different cultural practices among Slavs and Central Asians explain the observed mortality differentials?
Data artifacts? • Intercensal estimates of death registration coverage above age 60 (Guillot, 2004): • 90+ % as early as 1959 in urban areas • coverage in rural areas was low initially (~50%) but caught up with urban areas in 1980s • Total population: 92% for 1989-99 period • Adult deaths (20-59) usually better reported than deaths 60+
Migration effects? • 1/3 of Russian population has left Kyrgyzstan since 1991 • Could the increased disparity between Russian and Kyrgyz adult mortality be due to selective migration (healthy migrant effect)?
Cohort-specific changes in educational attainment, Males, 1989-99
Cohort-specific changes in educational attainment, Females, 1989-99
Cultural effects? • Analysis of causes of death by ethnicity, 1998-99 • Calculations based on micro-data • Deaths: vital registration (1998-99) • Exposure: census (March 1999) • Ages 20-59 • Ethnicity: Central Asians vs. Slavs • ~20,000 death records; ~2.2 million census records
Age-standardized Death Rates at working ages (per 100000), 1998-99, by cause and ethnicity, Males
Contribution of causes of death to the difference in life expectancy at working ages (40e20) between Slavs and Central Asians Males (total difference = 2.90 years)
Age-standardized Death Rates at working ages (per 100,000). Detailed Injuries, Males
Age-standardized Death Rates at working ages (per 100,000), 1998-99, by cause and ethnicity, Females
Contribution of causes of death to the difference in life expectancy at working ages (40e20) between Slavs and Central Asians Females (total difference = .28 years)
Age-standardized Death Rates at working ages (per 100,000) Detailed Injuries, Females
Alcohol-related Causes of Death(Chronic alcoholism, Alcohol psychoses, Alcohol cirrhosis of the liver, Accidental poisoning by alcohol) Age-standardized Death Rates at working ages (per 100,000)
Multivariate analysis • Do ethnic mortality differentials at adult ages remain once we account for differences in education and urban/rural residence? • Negative binomial regression • Dependent variable: deaths from all causes; deaths by major cause (7) • Explanatory variables: exposure, dummy variables for age, ethnicity, urban/rural residence, education (3 cat.) • Males and Females analyzed separately • Model 1: age, ethnicity • Model 2: age, ethnicity, education, residence
Risk Ratio Slavs/CAFemales NS NS NS NS NS NS NS NS
Conclusions • Excess mortality among adult Slavs (Soviet and post-Soviet period) is not likely due to data artifacts or migration effects • Excess mortality due to important ethnic differences in cause-specific mortality – alcohol and suicide in particular • Differences remain unexplained by education or residence
Conclusions • Role of cultural characteristics? • Alcohol tied to cultural practices (“culture of alcohol” among Russians; Impact of Islam for Central Asians) • Denser social networks and stronger social support among Central Asian ethnic groups?
Обследования населения, биомаркеры и продолжительность здоровой жизни Н.С. Гаврилова
Population surveys • Provide more detailed information on specific topics compared to censuses • Cover relatively small proportion of population (usually several thousand) • Population-based survey – random sample of the total population; represents existing groups of population
International Surveys in Russia and FSU • Russia Longitudinal Monitoring Survey (RLMS) http://www.cpc.unc.edu/rlms/ • Demographic and Health Surveys (DHS) are nationally-representative household surveys that provide data for a wide range of monitoring and impact evaluation indicators in the areas of population, health, and nutrition. http://www.measuredhs.com
http://www.cpc.unc.edu/projects/rlms 16 раундов обследования
Demographic and Health Surveys • Child Health - vaccinations, childhood illness • Education - highest level achieved, school enrollment • Family Planning knowledge and use of family planning, attitudes • Female Genital Cutting - prevalence of and attitudes about female genital cutting • Fertility and Fertility Preferences - total fertility rate, desired family size, marriage and sexual activity • Gender/Domestic Violence - history of domestic violence, frequency and consequences of violence • HIV/AIDS Knowledge, Attitudes, and Behavior - knowledge of HIV prevention, misconceptions, stigma, higher-risk sexual behavior • HIV Prevalence - Prevalence of HIV by demographic and behavioral characteristics • Household and Respondent Characteristics- electricity, access to water, possessions, education and school attendance, employment • Infant and Child Mortality - infant and child mortality rates • Malaria - knowledge about malaria transmission, use of bednets among children and women, frequency and treatment of fever • Maternal Health - access to antenatal, delivery and postnatal care • Maternal Mortality - maternal mortality ratio • Nutrition - breastfeeding, vitamin supplementation, anthropometry, anemia • Wealth/Socioeconomics - division of households into 5 wealth quintiles to show relationship between wealth, population and health indicators • Women's Empowerment - gender attitudes, women’s decision making power, education and employment of men vs. women
DHS sample designs • The sample is generally representative: • At the national level • At the residence level (urban-rural) • At the regional level (departments, states) The sample is usually based on a stratified two-stage cluster design: • First stage: Enumeration Areas (EA) are generally drawn from Census files • Second stage: in each EA selected, a sample of households is drawn from an updated list of households
DHS охватывает следующие страны б.СССР • Азербайджан • Казахстан (1995, 1999) • Кыргызстан (1997) • Молдова (2005) • Туркменистан (2000) • Узбекистан (1995, 2002)
Biomarkers in Population-Based Aging and Longevity Research Natalia Gavrilova, Ph.D. Stacy Tessler Lindau, MD, MAPP CCBAR Supported by the National Institutes of Health (P30 AG012857) NSHAP Supported by the National Institutes of Health (5R01AG021487) including: National Institute on AgingOffice of Research on Women's Health Office of AIDS ResearchOffice of Behavioral and Social Sciences Research
Goals: • Foster interdisciplinary research community • Establish means of exchanging rapidly evolving ideas related to biomarker collection in population-based health research • Translation to clinical, remote, understudied areas