Download
1 / 21
210 likes | 1.01k Views
Chapter 8 & 9 Atomic Absorption Spectroscopy. Atomic Absorption Process. A neutral atom in the gaseous state can absorb radiation and transfer an electron to an excited state.

E N D
Atomic Absorption Process • A neutral atom in the gaseous state can absorb radiation and transfer an electron to an excited state. • Simple electronic transitions possible with no vibrational and rotational energy levels possible. Bandwidth much narrower! • Occur at discreet l • Na(g) 3s ® 3p and 3p ® 5s as well as other transitions are possible at the correct photon energy a transition. Chapter 8&9 - 2
Atomic Absorption Transitions Chapter 8&9 - 3
THE FLAME AND EXCITED STATES • 3 steps required before measurements are possible in an A.A. experiment: 1. vaporization 2. reduction to the elemental state and then 3. exposure to radiation. • The first two steps are accomplished by a flame. • Effect of flame temperature: Since flame is at high temperature might have an effect on fraction of atoms in excited state. • Boltzmann's equation describes effect of flame temperature: where • N = # of atoms in a given state; • g = statistical factor for a given level and measures the number of possible electrons in each level; • g = 2J + 1 where J = Russel-Saunders coupling constant and is given by J = L + S or L S where L = orbital angular momentum quantum # (=0,1,2,3 for s, p, d, f respectively) and S = spin = ±½. • E.g. For the Na transition • 3s½® 3p3/2gu = 2(L+S) + 1 = 2(1 + ½) + 1 = 4 and go = 2(0 + ½) + 1 = 2. • 3s½ ® 3p½ go = 2 and gu = 2(1 - ½) + 1 = 2. • Overall population of both of these states: since they are only separated by 5Å, let's use average of their wavelengths and add population for the two excited states: • g = 4 + 2 = 6 and go = 2 (as before); lave 5892Å. Chapter 8&9 - 4
The Flame and Excited States • Assume Air-acetylene flame (2400°C): Temperatures for different flames used in AA are listed in text. T = (2400 + 273)K = 2673K; • Substituting into the Boltzmann equation: = 3.23x10⁴ • Very small fraction of the atoms in the flame are excited to this excited state. Chapter 8&9 - 5
Relative population of higher energy transitions • 3p ® 5s transition is also possible and has l = 6161Å (E = 3.22x10¹² erg. • The fraction of 3p electrons excited to the 5 s orbital is calculated as before: = 5.34x10⁻⁵ • Fraction involved in this transition even smaller. • Finally, we can estimate the fraction of electrons in the 5s state relative to the 3s state: = 5.34x105×3.23x104 = 1.72x10⁸ QED • Only very small proportion of the absorbing species is in the excited state from excitation by flame; higher energy transitions much less likely than the lower energy transitions. Chapter 8&9 - 6
MEASURING ATOMIC ABSORPTION • Recall Beer's Law (A = log = ebC ) is obeyed when line width small compared to absorption band. • Atoms or molecules absorb radiation at discrete wavelengths. • Broadband radiation contains photons of several wavelengths, some of which may be useful but many of which will not. This will make Po (= Pusable + Puseless) larger and the absorbance smaller than would be expected with only the usable portion of the light available for absorption. • Besides the Pusable can be composed of wavelengths with different absorptivities i.e. the sample does not absorb all radiation to the same degree. • Non-linear behavior observed when l range of excitation source is greater than l range of absorber; bandwidth of excitation source must be narrower than bandwidth of absorber. Chapter 8&9 - 7
Linewidth of Atomic Transitions • Natural linewidth of an absorption spectrum is very small (104Å) but is broadened by • Doppler broadening: Random thermal motions of atoms relative to the detector • Pressure broadening: In the atomic absorption experiment the pressure is large enough that atoms can undergo some interatomic collisions which cause small changes in the ground state levels. • Normal line width of excitation lines much greater than this line width • Monochromator cannot be used to select l range in AA (bandwidth few tenths of a nm). Chapter 8&9 - 8
SOURCES • Solution to line width problem: Use atomic source of same material. • e.g. For Na analysis Na vapor is used. • Atoms are excited by electrical discharge; the excited atoms emit a characteristic l. The bandwidth of the source << sample linewidth since it is generated under conditions where there is less broadening. • Hollow Cathode Tube : Hollow cathode made of the material needed is vaporized and emits radiation of the characteristic wavelength. • The ion current to the cathode controls photon intensity; Increasing the voltage between the anode and cathode will control the current and thus total photon flux. • Optimum current for each lamp (»1-20ma). Chapter 8&9 - 9
FORMATION OF ATOMIC VAPOR Four methods used to vaporize sample from solution: • Ovens: Sample placed in an oven; after evaporating solvent, sample vaporized into irradiation area by rapidly increasing temperature. • Electric arc or spark: Sample subjected to high current or high potential A.C. spark. • Ion bombardment: Sample placed on cathode and bombarded with + ions (Ar+). Sputtering process dislodges them from cathode and directs them to irradiation region. • Flame atomization: Sample sprayed into flame where it undergoes atomization and irradiation. Chapter 8&9 - 10
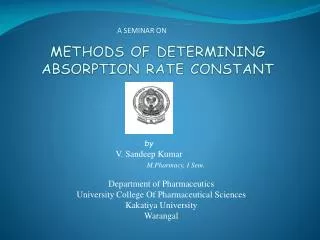
Undergraduate Instrumental Analysis, Robinson, p. 267. FLAME ATOMIZERS • Total consumption burner: Separate channels bring sample, fuel, and oxidant to combustion area. All of the sample, that is carried into the burner, is burned; • Sensitivity is greater than in a burner where the sample is not completely burned. • extra turbulence in the flame from variations in droplet size increase noise. Chapter 8&9 - 11
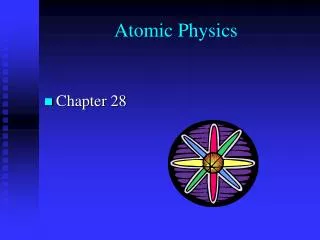
Instrumental Methods of Chemical Analysis, Ewing, p. 110. Premix (laminar flow) burner • Sample, fuel, and oxidant mixed prior to entering flame. • Turbulence drastically reduced by removing larger droplets. • Mixing baffles insure only fine mist makes it through to burner. Chapter 8&9 - 12
Instrumental Methods of Analysis, Willard,Merritt, Dean and Settle, p. 147 ELECTROTHERMAL ATOMIZATION • all of the sample used is atomized in furnace (electrothermal) atomizer. • detection limit is »100-1000x lower than with aspiration techniques. • only a few mL of solution is used. • Basic Principle: • sample container resistively heated to vaporize the metal atoms. • sample dried (evaporate solvent) at »110°C; • ash sample called "burn off" (200-300°C); • atomization.(2000-3000°C) • comparison with flame atomization: • interaction with sample matrix and electrode • poorer reproducibility • detection limits of 1010-1012g (or 1ppb) are possible. Chapter 8&9 - 13
FUELS/OXIDANTS • Low T flames : easily reduced elements (Cu, Pb, Zn, Cd) • High T flames: difficult to reduce elements (e.g. alkaline earths). • Fuels: natural gas, propane, butane, H2, and acetylene; • Oxidants- Air and O2 (low temperature flames). N2O (high temperature flames). • Flame characteristics: • Sample enters flame, is vaporized, reduced and eventually oxidized. • Exact region of flame in which each of these occurs depends upon: • flow rate, • drop size, and • oxidizability of sample. • Optimum position for flame for many metals. Chapter 8&9 - 14
Flame Profiles in AA Chapter 8&9 - 15
MEASUREMENT OF AA • Ideally, the amount of light reaching the detector is given by Beers Law: P = Po×10ebC . • several interferences can change this to: • P = Po×10ebC + Pemission Pbackground Pscattering. • Pemission is due to analyte emission in the flame • eliminated from the absorbance by modulation of the light source: measures only AC levels; emission DC level. • Pbackground, Pscattering: due to absorption by the flame or are induced by sample matrix and are independent of the analyte. • Broad band in nature. • Flame interferences nulled by comparing a blank with sample • Sample matrix is a problem. Caused by, for example, high salt content (e.g. NaCl or KI). These have broad band absorption spectrum in flame since they are not reduced by it. Most common approach uses secondary continuum source (e.g. D2 lamp): • Each lamp (D2 and HCT) modulated but are 180° out of phase with each other. • Detection system measures difference between two absorbance signals: AHCT = Asample + Abrdband while Acontinuum source = Abrd band. will be absorbance of sample. Chapter 8&9 - 16
D2 Source Elimination of Background Chapter 8&9 - 17
MONOCHROMATOR • Needed to choose one of several possible emission lines (lemitted) associated with HCT. • Since they are usually reasonably well separated from the line of interest, it is straightforward to use a monochromator to eliminate this interference. Chapter 8&9 - 18
ANALYTICAL TECHNIQUES • Beer's law, A = k×C, not always true making a calibration curve necessary. • Standard addition method is used to minimize the effects from the matrix • Anion- height of the absorbance peak is influenced by type and concentration of anion. It can reduce the number of atoms made. An unknown matrix is thus hard to correct for • Cation: The presence of a second cation sometimes causes stable compounds to form with the cation being analyzed. e.g. Al + Mg produces low results for Mg due to the formation of an Al/Mg oxide. Chapter 8&9 - 19
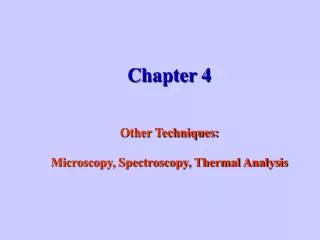
Sample Problem • The nickel content in river water was determined by AA analysis after 5.00 L was trapped by ion exchange. Rinsing the column with 25.0 mL of a salt solution released all of the nickel and the wash volume was adjusted to 75.00 mL; 10.00 mL aliquots of this solution were analyzed by AA after adding a volume of 0.0700 g Ni/mL to each. A plot of the results are shown below. Determine the concentration of the Ni in the river water. Chapter 8&9 - 20
Return to Slide 10 Chapter 8&9 - 21