Download
1 / 42
2.34k likes | 16.4k Views
A SEMINAR ON. METHODS OF DETERMINING ABSORPTION RATE CONSTANT. by V. Sandeep Kumar M.Pharmacy, I Sem. Department of Pharmaceutics University College Of Pharmaceutical Sciences Kakatiya University Warangal. CONTENTS. Introduction Methods To Detect Absorption Rate Constant.

E N D
A SEMINAR ON METHODS OF DETERMINING ABSORPTION RATE CONSTANT by V. Sandeep Kumar M.Pharmacy, I Sem. Department of Pharmaceutics University College Of Pharmaceutical Sciences Kakatiya University Warangal
CONTENTS • Introduction • Methods To Detect Absorption Rate Constant • Method of Residuals • Wagner-Nelson Method • Loo - Riegelman Method • Deconvolution Method • Estimation of ka from Urinary Data • Significance of Absorption Rate Constants • Conclusion • References
INTRODUCTION • Absorption can be defined as the process of movement of unchanged drug from site of administration to site of measurement i.e plasma. • The actual drug absorption process may be zero-order, first-order, or a combination of rate processes that is not easily quantitated.
METHOD OF RESIDUALS The technique is also known as feathering, peeling and stripping. • For a drug that follows one-compartmentkinetics and administered extra vascularlly, the time course of drug concentration in plasma is expressed by a bi exponential equation 1. →Equation-1
Equation 1 can be written as Cp = A.e-kel.t –A.e-ka.t →Equation- 2 where True plasma concentration values Figure 1. Semi-log plot of Cp versus Time after Oral Administration
During the elimination phase, when absorption is almost over,( Ka >> Kel ) and the value of second exponential approaches zero (e-kat) whereas the first exponentional (e-ket ) retains some finite value. At this time, the equation 2 reduced to Cp = A.e-kel.t →equation -3 where cp represents the back extrapolated plasma concentration values. A plot of log cp verses t gives terminal linear phase having slope = -kel /2.303. Back extrapolation of this straight line to time zero yields y-intercept equals to=log A
Intercept = Back extrapolation terminal portion of curve logCp Slope =- kel /2.303 Figure 2. Semi-log Plot of Cp versus Time after oral administration of single dose
Substracting of true plasma concentration values i.e. equation 2 from extrapolated plasma concentration values i.e. equation 3 yields a series of residual concentrationvalues . Cr = cp- cp →equation 4 Plotting the Cr versus time should give another straight line graph with a slope equal to – ka/2.303 and the same intercept as before, i.e. log A Cr = A.e –ka t
Intercept= Back extrapolated terminal portion of curve Residual curve True plasma concentration values Slope=- ka/2.303 Slope= -kel/2.303 Figure 3. Semi-log Plot of Cp versus Time
From the slope, the absorption rate constant Ka can be estimated.. In this method of calculation it is important to remember that the following assumptionsare made: 1. It is assumed that ka is at least five times larger than k el, if not neither constant can be determined accurately. 2. It is assumed that the absorption and elimination processes both follow the first order, if not the residual line and, perhaps, the elimination line will not be straight.
LAG TIME where FkaD0/V D(ka–k) is the y value at the point of intersection of the residual lines in . where A and B represents the intercepts after extrapolation of the residual lines for absorption and elimination, respectively. • The time delay prior to the commencement of the first order drug absorption is known as Lag time( t 0 ). • In some instances absorption of drug a single oral dose not started immediately due to such physiological factors as stomach-emptying time and intestinal mobility or due to formulation itself.
Back extrapolated terminal portion of curve Residual curve Lag time t0 Figure 4. Determination of lag time by graphically
Flip-Flop of ka and kel • The estimation of the rate constant for absorption and elimination by method of residuals is based on the assumption that ka>>kel. • If kel >> ka, then the values of ka from the terminal phase and kel from the residual line are obtained . • This phenomenon is called flip-flop of the absorption and elimination rate constant. • The only way to be sure of estimates is to compare kel calculated from oral administration with kelfrom intravenous data
METHOD OF RESIDUALS FOR TWO COMPARTMENT MODEL • There are three first order processes occurring simultaneously i.e. absorption, distribution and elimination • Plasma concentration of the drug depends initially on three process (three exponents), then on two processes of distribution and elimination (two exponentials) and finally on elimination process only ( mono exponential). C = C0 e-kat + A e-αt + B e-βt
Log CO True plasma concentration curve Log A Back extrapolated distribution curve Log B Back extrapolated elimination curve First residual curve Second residual curve Slope=-β/2.303 Log C Slope=-α/2.303 Slope=-ka/2.303 Figure 5
APPLICATIONS • To calculate absorption rate constant for a drug administered orally ,absorbed by first order kinetics and confer the characteristics of one and two compartment open model . • For a drug following intravenous administration and confer multy compartmental characteristics . LIMITATIONS When the absorption is complex rather than a simple first order process .
WAGNER-NELSON METHOD The Wagner-Nelson method of calculation does not require a model assumption concerning the absorption process The assumptions are (1) The body behaves as a single homogeneous compartment, (2) Drug elimination obeys the first order kinetics. For any e.v administration, The amount administered = The amount absorbed (A)+ The Amount unabsorbed (U)
The amount absorbed (A) to any time t = the amount of the drug in the body (X) + the amount of the drug eliminated from the body to any time, t (Xe) A = X + Xe 6 Taking the derivative with respective time dA/dt = dX/dt +dXe/dt 7 but X = Vd. C ,hence dX/dt = Vd. dC/dt and dXe/dt = KX therefore, dXe/dt = K.Vd.C therefore,
dA/dt = Vd. dC/dt + K.Vd.C dA = Vd.dC + K.Vd.C.dt 8 integrating equation 8 between limits of t = 0 to t = t gives, A0 = amount of drug absorbed at t = 0 is zero ,& C0 =0. so, Rearranging the above equation 9
Where At/Vd is the amount of drug absorbed up to time t divided by the volume of distribution Ct = plasma concentration at time t = AUC up to time t. Integrating equation 8 between the limits of t = 0 to t = And rearranging the equation, give the following 10 but C = 0, C 0= 0
Where, A/Vd = the total amount of drug absorbed from the dosage form up to infinity time divided by the volume of the distribution of the drug. = AUC up to The fraction ofabsorbed at any time is obtained when equation 9 is divided by equation 10 11 the fraction of unabsorbed at any time t is 12
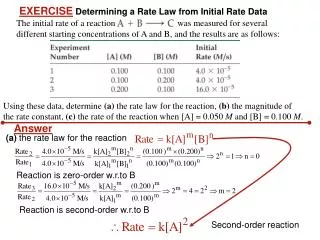
figure 6 figure 7 Slope=absorption rate constant Slope=-ka/2.303 Percent of unabsorbed drug versus time plot-Zero order Logarithm Percent of unabsorbed drug versus time plot-First order
Wagner Nelson Method Procedure • Plot log concentration of drug versus time. • Find K from the terminal part of slope when the slope is –K/2.303. • Find AUCt0 by plotting Cp versus time. • Find K.AUCtO by multiplying each AUCtO by K. • Find AUC0 by adding up all the AUC pieces, from t = 0 to t = . • Determine the 1-(Ab/Ab) value corresponding to each time point using by the table. • Plot 1-(Ab/Ab) versus time on semi log paper, with 1-(Ab/Ab)on the logarithmic axis.
For Example k = 0.1 hr– 1
APPLICATIONS • To understand the absorption kinetics without prior assumption . • Two formulations of a drug that differ substantially in terms of how much of drug is eventually absorbed which is reflected in • Vs time plots • LIMITATIONS • It applies rigorously only to the drugs with one compartmental characteristics . • However , when conc vs time curve after oral administration shows multi compartmental characteristics and on IV administration shows one compartmental model, analysis by this method gives incorrect result
LOO-RIEGELMAN METHOD • Loo -Riegelman method is useful in determining the absorption rate constant for a drug follows a two compartmentmodel. • It requires the plasma concentration time data after i.v. bolus and oral administration to obtain all necessary kinetic constants. • This method can be applied to drug that can distributed by any number of compartments
Ab = Xc +Xt +X3 → Equation 3.1 Xc = Vc.Cp Xt = Vt.Ct X3 = Vc.k13 ∫ C.dt = Vc.k13 .[AUC]0t Substituting of Xc and X3 into equation 3.1 Ab = Vc.Cp + Xt + Vc.k13 .[AUC]0t →Equation 3.2
Dividing the equation 3.2 by Vc, we get Ab/ Vc= Cp + Xt/Vc + K13 [AUC]0t →Equation 3.3 Setting the value of t = ∞, this equation becomes Ab∞ /Vc = 0+ 0 + K13 [AUC]0∞ Ab∞ /Vc = K13 [AUC]0∞ →Equation 3.4 • Where, Ab∞ is the amount of the drug that will be ultimately absorbed from the dosage form. F = Ab∞ /X0 →Equation 3.5
The fraction of the dose absorbed at any time in comparison with Ab∞ can be obtained by dividing the equation 3.3 by equation 3.4. →equation3.6 Slope= -Ka/2.303 Where, Xt /Vc = Ct = tissue concentration figure 8 Absorption rate constant by Loo- Riegelman method
→Equation 3.7 Where • Ct= Apparent tissue concentration • tn= time of sampling for sample n • tn-1 = time of sampling for the sampling point preceding sample n • (Cp) tn-1 = concentration of drug at central compartment for sample n-1 • ΔCp = concentration difference at central compartment between two sampling times. • = Time difference between two sampling times.
Example To Calculate Ct values K=0.16 hr– 1 ,k12 = 0.29 hr– 1, k21 = 0.31hr– 1.
APPLICATIONS • Loo Riegelman method is applicable for the drugs that confers multi compartmental characteristics . • LIMITATIONS • It requires the concentration vs time data of both oral and IV administration ofdrug to same subject. • An inherent limitation of this method is intra subject variability between oral and IV administration studies . The assumption be made that kinetics of drug distribution and elimination remain unchanged in interval between doses.
DECONVOLUTION METHOD • It is a model independent method for determining the absorption rate and its use has been limited. • It requires no assumptions regarding the no of compartments or kinetics of absorption . • Linear distribution and elimination are assumed. • It require both the data after oral and IV administration in same subject .
ESTIMATION Ka FROM URINARY DATA Using a plot of percent of drug unabsorbed versus time. For a one-compartment model Ab =DB+DE 5.1 5.2
Assuming first-order elimination kinetics with renal elimination constant ke 5.3 5.4 Rearranging Equation 5.3 Assuming a one-compartment model, Substituting VDCp into Equation 5.2 5.5 Substituting for dCp/ dt into Equation 5.5 and kDu/ ke for DE, 5.6
When the above expression is integrated from zero to time t, At t = ∞. The total amount of drug absorbed is Ab ∞and dD u/ dt = 0 Slope= -Ka/2.303 D∞u - total amount of unchanged drug excreted in the urine. The fraction of drug absorbed at any time t figure 9
LIMITATIONS • If the drug is rapidly absorbed, it may be difficult to obtain multiple early urine samples to describe the absorption phase accurately. • Drugs with very slow absorption will have low concentrations.
SIGNIFICANCE OF ABSORPTION RATE CONSTANT • The calculation of ka is useful in designing a multiple-dosage regimen. Knowledge of the ka and k allows for the prediction of peak and trough plasma drug concentrations following multiple dosing • The peak time (t max) in the plasma conc. versus time curve provides a convenient measure of absorption rate. • With the increase in absorption rate constant, C max also increases.
Effect of a change in the absorption rate constant, ka, on the plasma drug concentration-versus-time curve.
CONCLUSION • To compare different formulations of same drug. • The method of residual is used for the drugs which follow one or multi compartmental characteristics but the absorption process should not be complex . • Wagner nelson method is used for the drug confers one compartmental characteristics by orally. • Loo Riegelman method is applicable for the drug that confers multi compartmental characteristics . • Deconvolution method has limited use due to its complexity. • When there is lack of sufficiently sensitive analytic techniques to measure concentration of drugs in plasma, urinary excretion data is used.
REFERENCES • Leon Shargel, Susanna, Wu Pong, Andrew B.C.Yu, Applied Biopharmaceutics and Pharmacokinetics, Fifth Edition, Mc Graw Hill., pp.161-182. • Malcolm Rowland, Thomas N.Tozer, Clinical Pharmacokinetics,concepts and Applications, third edition,Waverly.,pp.119-130,478-484. • Milo Gibaldi and Donald Perrier, Pharmacokinetics; Second edition volume. 15, Marcel dekker., pp33-36,145-167,433-444. • V. Venkateshwarlu., Biopharmaceutics and pharmacokinetics, Pharma Book syndicate.,pp.221-224,259-263,385-387. • D.M.Brahmankar, SunilB.Jaiswal, Biopharmaceutics and pharmacokinetics ,a Treatise,pp.222-224,244-268, • www.australianprescriber.com • www.ncbi.nlm.nih.gov • www.boomer.org • www.medscape.com • www.pharmainfo.net