Download
1 / 66
670 likes | 822 Views
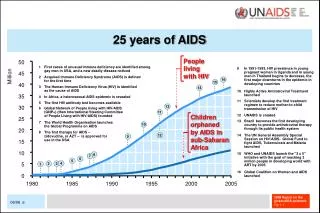
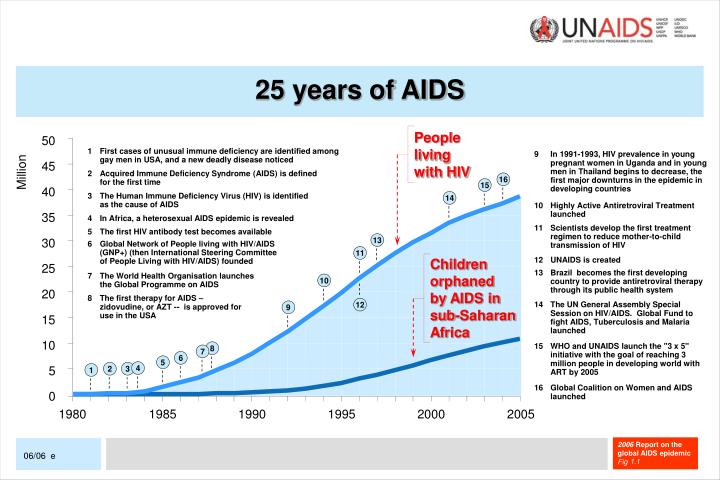
25 years of AIDS. People living with HIV. 50. 1 First cases of unusual immune deficiency are identified among gay men in USA, and a new deadly disease noticed.

E N D
25 years of AIDS People living with HIV 50 1 First cases of unusual immune deficiency are identified among gay men in USA, and a new deadly disease noticed 9 In 1991-1993, HIV prevalence in young pregnant women in Uganda and in young men in Thailand begins to decrease, the first major downturns in the epidemic in developing countries 45 Million 2 Acquired Immune Deficiency Syndrome (AIDS) is defined for the first time 40 3 The Human Immune Deficiency Virus (HIV) is identified as the cause of AIDS 10 Highly Active Antiretroviral Treatment launched 35 4 In Africa, a heterosexual AIDS epidemic is revealed 11 Scientists develop the first treatment regimen to reduce mother-to-child transmission of HIV 5 The first HIV antibody test becomes available 30 6 Global Network of People living with HIV/AIDS (GNP+) (then International Steering Committee of People Living with HIV/AIDS) founded 11 Children orphaned by AIDS in sub-Saharan Africa 12 UNAIDS is created 25 13 Brazil becomes the first developing country to provide antiretroviral therapy through its public health system 7 The World Health Organisation launches the Global Programme on AIDS 20 8 The first therapy for AIDS – zidovudine, or AZT -- is approved for use in the USA 14 The UN General Assembly Special Session on HIV/AIDS. Global Fund to fight AIDS, Tuberculosis and Malaria launched 15 12 10 15 WHO and UNAIDS launch the "3 x 5" initiative with the goal of reaching 3 million people in developing world with ART by 2005 5 9 1 2 4 6 8 5 13 14 15 16 7 10 3 16 Global Coalition on Women and AIDS launched 0 2005 1980 1985 1990 1995 2000 1.1
Burkina Faso 2.5 1.8 (2003) 4.2 2.1 2.0 Decline in urban areas Burundi 4.8 3.6 (2002) 6.0 3.3 3.3 Decline in capital city Cameroon 7.3† 5.5 (2004) 7.0 5.5 5.4 Stable Ghana 3.1 2.2 (2003) 3.1 2.3 2.3 Stable Guinea 4.2 1.5 (2005) 2.8 1.6 1.5 Stable Lesotho 28.4 23.5 (2004) 29.3 23.7 23.2 Stable Rwanda 4.6 3.0 (2005) 5.1 3.8 3.1 Decline in urban areas Senegal 1.9 0.7 (2005) 0.8 0.9 0.9 Stable Sierra Leone 3.0 1.5 (2005) - 1.6 1.6 Stable South Africa 29.5 16.2 (2005) 20.9 18.6 18.8 Increasing UR Tanzania 7.0 7.0 (2004) 9.0 6.6 6.5 Stable Uganda 6.2‡ 7.1 (2004‒5) 4.1 6.8 6.7 Stable Adult (aged 15‒49 years) HIV prevalence (%) in countries in sub-Saharan Africa which have conducted population-based HIV surveys in recent years Median HIV prevalence (%) among women attending antenatal clinics 2003‒2004* Population-based survey prevalence (%) (year) 2003 HIV prevalence (%) reported in 2004 Report on the global epidemic Adjusted 2003 HIV prevalence (%) in current report 2005 HIV prevalence (%) in current report Trend in prevalence Botswana 38.5 25.2 (2004) 38.0 24.0 24.1 Stable Ethiopia 8.5 1.6 (2005)§ 4.4 (1.0‒3.5) (0.9‒3.5) Decline in urban areas * WHO Africa (2005). HIV/AIDS epidemiological surveillance report for the WHO African region, 2005 Update. Harare † Estimate based on country report for 2002 (2003). Ministry of Public Health Cameroon. National HIV sentinel surveillance report 2002. ‡ Estimate based on country report for 2002 (2003). Ministry of Health Uganda. STD/HIV/AIDS surveillance report. STD/AIDS control programme. Kampala § Preliminary result. Additional analysis is ongoing. 2.1
Estimated number of people living with HIV and adult HIV prevalence Global HIV epidemic, 1990‒2005* HIV epidemic in sub-Saharan Africa, 1985‒2005* Number of people living with HIV (millions) % HIV prevalence, adult (15‒49) Number of people living with HIV (millions) % HIV prevalence, adult (15‒49) 50 5.0 30 15.0 12.5 25 40 4.0 20 10.0 30 3.0 7.5 15 20 2.0 5.0 10 10 1.0 2.5 5 0 0.0 0 0.0 1990 1995 2000 2005 1985 1990 1995 2000 2005 *Even though the HIV prevalence rates have stabilized in sub-Saharan Africa, the actual number of people infected continues to grow because of population growth. Applying the same prevalence rate to a growing population will result in increasing numbers of people living with HIV. Number of people living with HIV % HIV prevalence, adult (15-49) This bar indicates the range around the estimate 2.2
Regional HIV and AIDS statistics and features, 2003 and 2005 REGION Adults (15+) and children living with HIV Adults (15+) and children newly infected with HIV Adult (15-49) prevalence (%) Adult (15+) and child deaths due to AIDS 2005 2003 2005 2003 2005 2003 2005 2003 Sub-Saharan Africa 24.5 million [21.6‒27.4 million] 23.5 million [20.8‒26.3 million] 2.7 million [2.3‒3.1 million] 2.6 million [2.3‒3.0 million] 6.1 [5.4‒6.8] 6.2 [5.5‒7.0] 2.0 million [1.7‒2.3 million] 1.9 million [1.7‒2.3 million] North Africa and Middle East 440 000 [250 000‒720 000] 380 000 [220 000‒620 000] 64 000 [38 000‒210 000 54 000 [31 000‒150 000 0.2 [0.1‒0.4] 0.2 [0.1‒0.3] 37 000 [20 000‒62 000] 34 000 [18 000‒57 000] Asia 8.3 million [5.7‒12.5 million] 7.6 million [5.2‒11.3 million] 930 000 [620 000‒2.4 million] 860 000 [560 000‒2.3 million] 0.4 [0.3‒0.6] 0.4 [0.2‒0.6] 600 000 [400 000‒850 000] 500 000 [340 000‒710 000] Oceania 78 000 [48 000‒170 000] 66 000 [41 000‒140 000] 7200 [3500‒55 000] 9000 [4300-69 000] 0.3 [0.2‒0.8] 0.3 [0.2‒0.7] 3400 [1900‒5500] 2300 [1300‒3600] Latin America 1.6 million [1.2‒2.4 million] 1.4 million [1.1‒2.0 million] 140 000 [100 000‒420 000] 130 000 [95 000‒310 000] 0.5 [0.4‒1.2] 0.5 [0.4‒0.7] 59 000 [47 000‒76 000] 51 000 [40 000‒67 000] Caribbean 330 000 [240 000‒420 000] 310 000 [230 000‒400 000] 37 000 [26 000‒54 000] 34 000 [24 000‒47 000] 1.6 [1.1‒2.2] 1.5 [1.1‒2.0] 27 000 [19 000‒36 000] 28 000 [19 000‒38 000] Eastern Europe and Central Asia 1.5 million [1.0‒2.3 million] 1.1 million [790 000‒1.7 million] 220 000 [150 000‒650 000] 160 000 [110 000‒440 000] 0.8 [0.6‒1.4] 0.6 [0.4‒1.0] 53 000 [36 000‒75 000] 28 000 [19 000‒39 000] North America, Western and Central Europe 2.0 million [1.4‒2.9 million] 1.8 million [1.3‒2.7 million] 65 000 [52 000‒98 000] 65 000 [52 000‒98 000] 0.5 [0.4‒0.7] 0.5 [0.3‒0.6] 30 000 [24 000‒45 000] 30 000 [24 000‒45 000] TOTAL 38.6 million [33.4‒46.0 million] 36.2 million [31.4‒42.9 million] 4.1 million [3.4‒6.2 million] 3.9 million [3.3‒5.8 million] 1.0 [0.9‒1.2] 1.0 [0.8‒1.2] 2.8 million [2.4‒3.3 million] 2.6 million [2.2‒3.1 million] 2.3
A global view of HIV infection 38.6 million people [33.4‒46.0 million] living with HIV, 2005 2.4
HIV prevalence (%) among pregnant women attending antenatal clinics in sub-Saharan Africa, 1997/98‒2004 Southern Africa Eastern Africa 50 20 Swaziland United Republic of Tanzania 40 15 Zimbabwe 30 Ethiopia 10 Median HIV prevalence (%) Median HIV prevalence (%) 20 Kenya South Africa Mozambique 5 10 0 0 1997‒ 1998 1999‒ 2000 2001 2002 2003 2004 1997‒ 1998 1999‒ 2000 2001 2002 2003 2004 West Africa 20 15 Note: Analysis restricted to consistent surveillance sites for all countries except South Africa (by province) and Swaziland (by region) 10 Median HIV prevalence (%) Côte d'Ivoire Burkina Faso 5 Ghana Senegal 0 1997‒ 1998 1999‒ 2000 2001 2002 2003 2004 Sources: Ministry of Health (Mozambique); Department of Health (South Africa); Ministry of Health and Social Welfare (Swaziland); Ministry of Health and Child Welfare (Zimbabwe); Adapted from Asamoah-Odei, et al. HIV prevalence and trends in sub-Saharan Africa: no decline and large subregional differences. Lancet, 2004 (Ethiopia); Ministry of Health—National AIDS/STD Control Programme (Kenya); Ministry of Health (United Republic of Tanzania); Conseil national de lutte contre le sida et les IST (Burkina Faso); Centers for Disease Control and Prevention (CDC)—GAP—Côte d'Ivoire (Côte d'Ivoire); Ghana Health Service (Ghana); Conseil National de Lutte Contre le SIDA (Senegal). 2.6
HIV prevalence (%) by gender and urban/rural residence, selected sub-Saharan African countries, 2001‒2005 30 15‒49 years old, by gender 20 Women Men % 10 0 30 Women Men 15‒24 years old, by gender 20 % 10 0 30 15‒49 years old, by urban/ rural residence 20 Urban Rural % 10 0 Lesotho South Africa Zambia Kenya Uganda UR Tanzania Burkina Faso Ghana Guinea Senegal South East West Sources: Demographic and Health Survey reports (Lesotho, Zambia, Kenya, Burkina Faso, Ghana, Guinea and Senegal) (2001–2005). Nelson Mandela Foundation (South Africa) (2005). Ministry of Health (Uganda). Tanzania Commission for AIDS (UR Tanzania) (2005). 2.7
HIV prevalence (%) trends in India among injecting drug users and pregnant women, selected areas, India, 1998–2004* 15.0 12.0 Delhi Injecting drug users 9.0 Mizoram % 6.0 3.0 West Bengal 0.0 1998 1999 2000 2001 2002 2003 2004 1998 1999 2000 2001 2002 2003 2004 Madhya Pradesh 1.5 1.2 Antenatal clinic attendees Mizoram 0.9 % Uttar Prahesh 0.6 0.3 West Bengal 0.0 5.0 Andhra Pradesh 4.0 Antenatal Clinic attendees Karnataka 3.0 % 2.0 Maharashtra *Data from consistent surveillance sites only. 1.0 Tamil Nadu 0.0 1998 1999 2000 2001 2002 2003 2004 2.9
HIV prevalence trends among pregnant women in major cities in Cambodia, Myanmar and Thailand, 1990–2004 5.0 % HIV prevalence 4.0 3.0 2.0 1.0 1990 1992 1994 1996 1998 2000 2002 2004 1991 1993 1995 1997 1999 2001 2003 0.0 Phnom Penh Mandalay and Yangon Bangkok Sources: Cambodia National Center for HIV/AIDS, Dermatology and STDs (Phnom Penh); Myanmar Ministry of Health (Mandalay and Yangon); Thailand Ministry of Public Health (Bangkok), 2005. 2.10
HIV prevalence (%) trends among injecting drug users in Bangladesh, Pakistan and the Philippines, 1998–2005* Bangladesh Pakistan [Karachi] 6% 30% Central A 4% 20% 2% 10% Northwest F1 Southeast D 0% 0% 1998– 1999 1999– 2000 2000– 2001 2002 2003– 2004 2004– 2005 2003 2004 Philippines [Cebu City] * Other sites in Bangladesh and Pakistan continue to show very low HIV prevalence in their latest surveillance surveys (0% in 13 sites in Bangladesh, and 0.5% in Lahore, Pakistan) 6% 4% 2% 0.0 0.0 0% 2002 2003 2004 2005 Sources: 2005 Integrated HIV Behavioral and Serologic Surveillance Findings, Summary Report. National Epidemiology Center, Department of Health (Philippines); National HIV Serological Surveillance, 2004-2005, 6th Round Technical Report. Natonal AIDS/STD Programme, Ministry of Health and Family Welfare (Bangladesh); National Study of Reproductive Tract and Sexually Transmitted Infections, Survey of High Risk Groups in Lahore and Karachi, 2005. National AIDS Control Program, Ministry of Health (Pakistan) 2.11
120 000 105 000 90 000 75 000 60 000 45 000 30 000 15 000 0 Increase in reported HIV cases in the Russian Federation and Ukraine, 1987–2005 Reported HIV cases in the Russian Federation Reported HIV cases in Ukraine 400 000 Russian Federation 350 000 Newly reported cases 300 000 Cumulative (previous years) 250 000 Ukraine 200 000 Newly reported cases 150 000 Cumulative (previous years) 100 000 50 000 0 1987 1989 1991 1993 1995 1997 1999 2001 2003 2005 Sources: Russian Federal AIDS Centre; Ukranian AIDS Centre and Ministry of Health of Ukraine 2.12
HIV prevalence (%) in adults in Latin America and the Caribbean, 2005 2.13
Argentina Ecuador Quito Buenos Aires Provinces (7 cities) Guayaquil Bolivia La Paz Other city ports (4) Paraguay Asunción and 4 other cities Santa Cruz Peru Border cities with Argentina Lima Chile 0.0 Santiago Provinces Colombia Uruguay Bogotá Montevideo Border cities with Brazil 0 5 10 15 20 25 30 Venezuela 0.0 % HIV prevalence Isla Margarita 0 5 10 15 20 25 30 % HIV prevalence Female sex workers Men who have sex with men HIV prevalence (%) among female sex workers and men who have sex with men in Latin America, 1999–2002 Source: Montano SM et al., JAIDS (2005). 2.14
2005 Country progress towards 2001 Declaration of Commitment on HIV/AIDS—Global targets (low- and middle-income countries)[First of 2 slides] GLOBAL RESULTS 2005 GLOBAL TARGETS 2005 Total annual expenditure* US$ 8 297 000 000 Estimated range: US$ 7.5 billion‒US$ 8.5 billion US$ 7.0 billion‒US$ 10.0 billion Global target achieved Percentage of youth aged 15‒24 who correctly identify ways of preventing HIV transmission and who reject major misconceptions about HIV transmission** MALE: 33% (Country range: 7%‒50% coverage), (n=16) FEMALE: 20% (Country range: 8%‒44% coverage), (n=17) 90% coverage No country achieved this Percentage of HIV-positive pregnant women receiving antiretroviral prophylaxis*** 9% (Country range: 1%‒59% coverage), (n=41) 80% coverage No country achieved this Percentage of people with advanced HIV infection receiving antiretroviral therapy**** 20% (Country range: 1%‒100% coverage), (n=116) 1 300 000 people on treatment 50% coverage (3 million people on treatment) 21 countries achieved this Global target not achieved * See ‘Financing’ chapter ** Demographic and Health Survey/AIDS Indicator Survey, 2001‒2005 (MEASURE DHS, 2006) *** Stover et al. (2006) **** “3 by 5” Report (WHO/UNAIDS, 2006) 3.1a
2005 Country progress towards 2001 Declaration of Commitment on HIV/AIDS—Global targets (low- and middle-income countries)[Last of 2 slides] GLOBAL RESULTS 2005 GLOBAL TARGETS 2005 Percentage of young males and females, aged 15‒24, who are HIV infected***** MALES: 1.4% (Measure of uncertainty: 1.1%‒1.8%), (n=54) FEMALES: 3.8% (Measure of uncertainty: 3.0%‒4.7%), (n=54) No comparable global data on this age cohort is available from 2001. Progress towards target can only be measured in individual countries. 25% reduction in most affected countries 6 of the most affected countries achieved this Estimated percentage of infants born to HIV-infected mothers who are infected in 2005****** 26% of infants born to HIV-infected mothers were also infected (n=33 most affected countries) In 2001, approximately 30% of infants were infected. There has been an estimated 10% reduction in HIV transmission between 2001 and 2005. 20% reduction 11 of the most affected countries achieved this ***** UNAIDS/WHO 2005 Estimates for countries with generalized epidemics ****** UNAIDS/WHO 2005 Estimates 3.1b
Comparison of 2003 and 2005 data on the coverage of antiretroviral therapy, access to mother-to-child prevention services and coverage of HIV-infected mothers who received antiretroviral prophylaxis to prevent mother-to-child transmission Access to mother-to-child prevention services (all pregnant women) Coverage of HIV-infected mothers who received antiretroviral prophylaxis Coverage of antiretroviral therapy 25 25 25 20.0 20 20 20 15 15 15 % % % 9.2 9.0 10 10 10 7.6 7.0 5 5 5 3.3 0 0 0 2003 2005 2003 2005 2003 2005 Sources: WHO/UNAIDS (2006). Progress on global access to HIV antiretroviral therapy: a report on “3 by 5” and beyond; USAID et al. (2006). Coverage of selected services for HIV/AIDS prevention, care and support in low and middle income countries in 2003 and 2005. 3.2
Comparison of 2003 and 2005 data on the expansion of antiretroviral therapy and coverage of HIV-infected mothers who received antiretroviral prophylaxis in three sub-Saharan African countries Coverage of HIV-infected mothers who received antiretroviral prophylaxis Coverage of antiretroviral therapy 60 60 56.0 50 50 40 40 35.0 30 30 % % 25.0 19.7 20 20 12.0 9.3 7.0 10 10 6.3 4.6 3.0 1.0 0.0 0 0 Kenya Namibia Uganda Kenya Namibia Uganda 2003 2005 Sources: Individual country reports (2005). 3.3
Comprehensive knowledge about HIV and AIDS among young males aged 15–24, by level of education, in 11 sub-Saharan African countries, 2000–2004 80 70 60 50 % 40 30 20 10 0 Burkina Faso Ghana Mali Namibia Rwanda Zambia Cameroon Kenya Mozambique Nigeria Uganda No education Primary education Secondary education and beyond Sources: Demographic and Health Surveys; HIV/AIDS Indicator Surveys (2000–2004). 3.4
Comprehensive knowledge about HIV and AIDS among young females aged 15–24, by level of education, in 11 sub-Saharan African countries, 2000–2004 80 70 60 50 % 40 30 20 10 0 Burkina Faso Ghana Mali Namibia Rwanda Zambia : Cameroon Kenya Mozambique Nigeria Uganda No education Primary education Secondary education and beyond Sources: Demographic and Health Surveys; HIV/AIDS Indicator Surveys (2000–2004). 3.5
Percentage of young people aged 15–24 reporting the use of a condom during sexual intercourse with a non-regular partner, Sub-Saharan Africa, 2001–2005 Benin 2001 Botswana 2001 Countries with date of survey indicated Burkina Faso 2003 Cameroon 2004 Chad 2004 Ghana 2003 Guinea 2005 Kenya 2003 Lesotho 2004 Madagascar 2003 Malawi 2004 Mali 2001 Mozambique 2003 Nigeria 2003 Rwanda 2004 Senegal 2005 United Republic of Tanzania 2003 Uganda 2004 Zambia 2003 0 10 20 30 40 50 60 70 80 90 100 % Female Male Sources: Demographic Health Surveys; HIV/AIDS Indicator Surveys (2001-2005). 3.6
Median percentage of most-at-risk populations reached with prevention programmes and those who received HIV testing in the last 12 months and who knew their results 50 42% (n=13) 40 38% (n=9) 30 28% (n=10) % 23% (n=10) 19% (n=10) 20 17% (n=10) 10 0 Percentage who received HIV testing and who knew their results Percentage reached with prevention programmes Sex workers Men who have sex with men Injecting drug users 3.7
Estimated total annual resources available for AIDS, 1996‒2005 9000 • Data include: • International donors, domestic spending (including public spending and out-of-pocket expenditures) • International Foundations and Global Fund included from 2003 onwards, PEPFAR included from 2004 onwards • * Projections based on previous pledges and commitments (range of the estimation: US$7.5 to US$8.5 billion). Signing of Declaration of Commitment on HIV/AIDS 8297* 8000 7000 6000 5000 US$ million 4000 3000 2000 1623 1000 292 0 1996 1997 1998 1999 2000 2001 2002 2003 2004 2005 3.8
Per capita HIV and AIDS expenditures by country income level* 2.5 2.0 Low income Lower middle 1.5 US$ per capita Higher middle 1.0 Low income SSA 0.5 0.0 2000 2001 2002 2003 2004 2005 • Trends based on a sample of 25 countries from sub-Saharan Africa • and 57 countries from other regions 3.9
Progress towards achieving the “Three Ones”: Percentage of countries with one national coordinating body, one national HIV/AIDS strategy or framework and one national monitoring and evaluation plan 100 90 85 80 60 50 % 40 20 0 National body National framework National monitoring and evaluation plan 3.10
Impact of AIDS on life expectancy in five African countries, 1970–2010 70 65 60 Botswana 55 South Africa Life expectancy at birth (years) 50 45 Swaziland 40 35 Zambia 30 Zimbabwe 25 20 1970–1975 1980–1985 1990–1995 2000–2005 1975–1980 1985–1990 1995–2000 2005–2010 Source: United Nations Population Division (2004). World Population Prospects: The 2004 Revision, database. 4.1
Percentage of distribution of deaths by age in southern Africa, 1985–1990 and 2000–2005 40 35 30 25 Percentage of total deaths 20 15 10 5 0 0–4 5–19 20–29 30–39 40–49 50–59 60+ Age-groups : 1985-1990 2000-2005 Source: Population Division of the Department of Economic and Social Affairs of the United Nations Secretariat (2005). World Population Prospects: The 2004 Revision. Highlights. New York: United Nations. 4.2
Wealth, poverty and HIV: countries grouped by region and HIV prevalence 80 Industrialized countries Countries with HIV prevalence over 1.9% in 2002 Countries according to level of HIV prevalence in 2001 (%) 70 60 % 50 40 30 20 10 All (48) Africa Asia* Latin America and Caribbean 1-5 5-10 10-20 over 20 0 % of population living on less that $1 per day Relative income of richest 10% to poorest 10% *except Japan Source: UN Population Division( 2005a). Most figures relate to 2002, or earlier. 4.3
Violations of reproductive rights— women surveyed in four Asian countries 70 60 50 40 % 30 20 10 0 India Indonesia Philippines Thailand Total Mandatory HIV testing during pregnancy or due to illness of child Coerced into abortion due to HIV status Advised not to have a child since HIV-positive diagnosis Source: Paxton S, et al. (2005) AIDS-related discrimination in Asia. 4.4
TB notification rate in 20 African countries* versus HIV prevalence in sub-Saharan Africa, 1990–2004 200 8 180 7 160 6 140 5 % Adult HIV prevalence (15-49) 120 TB notification rate per 100,000 population 100 4 80 3 60 HIV prevalence 2 40 TB notification rate 1 20 0 0 1990 1991 1992 1993 1994 1995 1996 1997 1998 1999 2000 2001 2002 2003 2004 • Consistently reporting each year: Algeria, Angola, Botswana, Cameroon, Comoros, Congo, Côte d'Ivoire, Democratic Republic of Congo, Ghana, Guinea, Kenya, Malawi, Mauritius, Mozambique, Nigeria, Senegal, South Africa, Uganda, United Republic of Tanzania, Zimbabwe Sources: World Health Organization (2006), Global TB database; UNAIDS (2006) 4.5
Estimated impact of AIDS on under-five mortality rates 2002–2005, selected countries in sub-Saharan Africa 42 Botswana 106 98 Kenya 118 Lesotho 71 123 Without AIDS 43 Namibia 78 With AIDS 43 South Africa 74 Swaziland 73 143 142 Zambia 173 78 Zimbabwe 117 0 20 40 60 80 100 120 140 160 180 200 Deaths per 1,000 live births Sources: UNICEF (2005); United Nations Population Division, World Population Prospects: The 2004 Revision, database. 4.6
Source: Roeland Monasch and J. Ties Boerma, Orphanhood and childcare patterns in sub-Saharan Africa: an analysis of national surveys from 40 countries. AIDS 2004, 18 (suppl 2): S55-S65. Impact of orphanhood on school attendance among 10–14-year-olds (%) 4.7
Projected reduction in African agricultural labour force due to HIV and AIDS by 2020 Namibia Botswana Zimbabwe Mozambique South Africa Kenya Malawi Uganda UR Tanzania Central African Republic 2020 2000 Côte d’Ivoire Cameroon 0 Projected labor force loss (%) by year 5 10 15 20 25 30 Sources: ILO (2004). HIV/AIDS and work: global estimates, impact and responses 4.8
Impact of three scenarios on HIV infection in sub-Saharan Africa, 2003–2020 5.0 4.0 Number of new HIV infections (millions) 3.0 2.0 1.0 0.0 2003 2005 2010 2015 2020 Year Baseline Treatment-centered Prevention-centered Comprehensive response Source: Salomon JA et al. (2005). Integrating HIV prevention and treatment: from slogans to impact 6.1
Impact of AIDS-related deaths in sub-Saharan Africa, 2003–2020 3.0 2.5 Number of AIDS- related deaths (millions) 2.0 1.5 1.0 0.5 0.0 2003 2005 2010 2015 2020 Year Baseline Treatment-centered Prevention-centered Comprehensive response Source: Salomon JA et al. (2005). Integrating HIV prevention and treatment: from slogans to impact 6.2
Number of people on antiretroviral therapy in low- and middle-income countries, 2002–2005 1400 1200 People receiving therapy (thousands) North Africa and the Middle East 1000 Europe and Central Asia 800 East, South and South-East Asia 600 Latin America and the Caribbean Sub-Saharan Africa 400 200 0 End 2002 Mid- 2003 End 2003 Mid- 2004 End 2004 Mid- 2005 End 2005 Source: WHO/UNAIDS (2005). Progress on global access to HIV antiretroviral therapy: An update on “3 by 5.” 7.1
People in sub-Saharan Africa on antiretroviral treatment as percentage of those in need, 2002–2005 2005 2002 2003 2004 Source: WHO/UNAIDS (2005). Progress on global access to HIV antiretroviral therapy: An update on “3 by 5.” 7.2
Percentage of people on treatment who are children, by country, 2005 Latin America and Caribbean[Median: 8%] Africa[Median: 7%] Panama Honduras UR Tanzania Argentina Uganda Haiti Central African Republic Guyana Zambia Brazil South Africa El Salvador Kenya Venezuela Zimbabwe Peru Namibia Rwanda 0% 2% 4% 6% 8% 10% 12% 14% 16% Mozambique Malawi Asia[Median: 4%] Côte d'Ivoire Nigeria Cambodia Ghana Viet Nam India 0% 2% 4% 6% 8% 10% 12% 14% 16% China 0% 2% 4% 6% 8% 10% 12% 14% 16% Source: WHO/UNAIDS (2005). Progress on global access to HIV antiretroviral therapy: An update on “3 by 5.” 7.3 Source: WHO/UNAIDS (2005). Progress on global access to HIV antiretroviral therapy: An update on "3 by 5."
Women as a percentage of all adults receiving antiretroviral therapy in 30 countries: actual versus expected percentages, 2005a Sub-Saharan Africa Latin America and Caribbean Argentina Botswana Brazil Burundi El Salvador Central African Republic Côte d'Ivoire Guyana Ethiopia Haiti Honduras Ghana Panama Kenya Peru Malawi Mozambique Venezuela Namibia 0% 20% 40% 60% 80% Nigeria Rwanda Asia South Africa UR Tanzania Cambodia Uganda China Zambia India Zimbabwe Viet Nam 0% 20% 40% 60% 80% 0% 20% 40% 60% 80% a The expected percentage of women receiving ARV therapy is based on the percentage of people living with HIV/AIDS who are women Expected percentage of women receiving ARV therapy Source: WHO/UNAIDS (2006). Progress on global access to HIV antiretroviral therapy. A report on “3 by 5” and beyond. 7.4
Country Coordinating Mechanisms (CCMs): Entities participating in preparation of Round Four proposals, 100% = all representatives of all 78 surveyed CCMs Religious/faith-based groups 5% Private sector 7% 20% Government health ministry People living with the disease 4% Academic/educational 4% organizations 19% Government other ministries NGO/community-based 17% organizations International NGOs 3% 15% UN/Multilateral agencies Bilateral agencies 6% Non-public sector Public sector Source: The Global Fund to Fight AIDS, Tuberculosis and Malaria 9.1
Sector of recipients 51% Government 25% Non-governmental and community-based organizations 4% People living with HIV, Tuberculosis or Malaria 5% Academic institutions 5% Faith-based organizations 5% Private sector 5% Other Source: The Global Fund to Fight AIDS, Tuberculosis and Malaria. Rounds 2‒4 only. Information not available for Round 1. 9.2
AIDS funding requirements for low- and middle-income countries US$ billion 2006 2007 2008 2006‒2008 Prevention 8.4 10.0 11.4 29.8 Care and treatment 3.0 4.0 5.3 12.3 Support for orphans and vulnerable children 1.6 2.1 2.7 6.4 Programme costs 1.5 1.4 1.8 4.6 Human resources 0.4 0.6 0.9 1.9 TOTAL 14.9 18.1 22.1 55.1 Source: UNAIDS (2005). Resource needs for an expanded response to AIDS in low- and middle-income countries. 10.1
Funding required for prevention Source: UNAIDS (2005). Resource needs for an expanded response to AIDS in low- and middle-income countries. 10.2
Distribution by region of the funding required for prevention Latin America/Caribbean: 9% Eastern Europe: 12% North Africa/Middle East: 3% Africa: 29% South/South-East Asia: 21% East Asia/Pacific: 26% Source: UNAIDS (2005). Resource needs for an expanded response to AIDS in low- and middle-income countries. 10.3
Funding required for treatment and care, including antiretroviral therapy (ART), in order to achieve the coverage targets shown Source: UNAIDS (2005). Resource needs for an expanded response to AIDS in low- and middle-income countries. 10.4
Distribution by activity of the funding required for treatment and care Source: UNAIDS (2005). Resource needs for an expanded response to AIDS in low- and middle-income countries. 10.5
Distribution by region of the funding required for treatment and care Latin America/Caribbean: 17% Eastern Europe: 7% North Africa/Middle East: 1% Africa: 55% South/South-East Asia: 4% East Asia/Pacific: 16% Source: UNAIDS (2005). Resource needs for an expanded response to AIDS in low- and middle-income countries. 10.6
Funding required for activities supporting orphans and vulnerable children Source: UNAIDS (2005). Resource needs for an expanded response to AIDS in low- and middle-income countries. 10.7