Download
1 / 9
90 likes | 178 Views
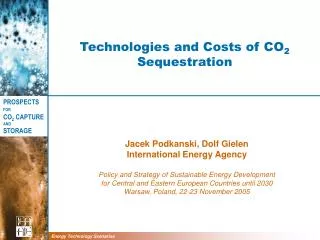
Estimate of CO 2 Marginal abatement costs for Portugal using the TIMES_PT model. Sofia Simões, João Cleto, Patrícia Fortes, Júlia Seixas. Environmental Sciences and Engineering Department New University of Lisbon Portugal. Implementation of TIMES_PT. NEEDS. NEEDS. E 2 POL.

E N D
Estimate of CO2 Marginal abatement costs for Portugal using the TIMES_PT model Sofia Simões, João Cleto, Patrícia Fortes, Júlia Seixas Environmental Sciences and Engineering Department New University of Lisbon Portugal
Implementation of TIMES_PT NEEDS NEEDS E2POL EU research project Evaluation of total costs and benefits of energy policies and future energy systems http://www.needs-project.org/nf2.asp National research project Quantifying interactions between energy and environment policy instruments http://air.dcea.fct.unl.pt/projects/e2pol/ TIMES_PT Implementation of TIMES for Portugal: 2000-2030 (2050)
TIMES_PT - main assumptions Calibration assumptions • Max CHP penetration in industry – up to 50% of ind. electricity consumed in 2030 • Max natural gas penetration of 85% • Inertia factors in residential and commercial sectors • Limits on electricity imports (+255% than 2000) and exports (+121% than 2000)
CO2 Marginal abatement costs curve (I) -30% -20% -10% +10% 0% +20% Kyoto -30% -20% -10% 0% +10% +20% Kyoto
CO2 Marginal abatement costs curve (II) 113% Nat. Estimates - High Reference Scenario 100% Nat. Estimates Low Reference Scenario
Primary energy 14% 17% 16% 12% 17% 19% 21% 22% 24% 22% 23% 29% 27% 33% 30%
CO2 abatement compared to Kyoto scenario 19% 15% 18% 12% 18% 22% 27% 32% 42% 45% 47% 31% 47% 42% 44% 44% 28% 40% 45% 35% 30% 57% 61% 78% 33% 13% 11% 99% 16% 18%
sgcs@fct.unl.ptjfcn@fct.unl.ptp.fs@fct.unl.ptmjs@fct.unl.pthttp://air.dcea.fct.unl.pt/projects/e2pol/sgcs@fct.unl.ptjfcn@fct.unl.ptp.fs@fct.unl.ptmjs@fct.unl.pthttp://air.dcea.fct.unl.pt/projects/e2pol/