Download
1 / 48
480 likes | 600 Views
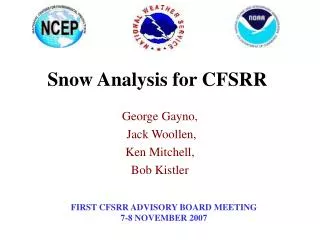
Some Problems in CFSRR Investigated and Solutions Tested for CFSRL Jack Woollen , Bob Kistler , Craig Long, Daryl Kleist, Xingren Wu, Suru Saha , Wesley Ebisuzaki. Introduction.

E N D
Some Problems in CFSRR Investigated and Solutions Tested for CFSRL Jack Woollen, Bob Kistler, Craig Long, Daryl Kleist, Xingren Wu, SuruSaha, Wesley Ebisuzaki
Introduction Following an intense effort to complete the CFSRR reanalysis for 1979-2010, which contained many new features, and had to be conducted in a very strict timeframe, problems became evident in the results. Several were serious enough that a lower resolution rerun of the CFSRR (named the CFSRL), was proposed to address and correct them, and to run through the period 1948 to the present as a replacement for the R1 product. The presentation describes our experience addressing four problems affecting the atmospheric part of the CFSRR, pre-1998, and how they are to resolved in the CFSRL system.
We looked at 4 issues: • SSU bias correction • Asian radiosonde radiation corrections • Tropical tropospheric cold bias • QBO wind analysis
We accomplished 3 objectives: • Devise and/or install a solution for each issue • Run 8 years of “CFSRL” testing • (1979-1986) for validation • Run 2 additional 2-year experiments to further develop the QBO analysis • (82-83, 98-99)
Issue #1 Extreme Stratospheric Temperature Variations With Jumps At Processing Stream Boundaries
Prior to 1998 the SSU assimilation is implicated, especially bias correction of channel 3 Model warm bias feeds into SSU bias correction and heats up the stratosphere until a stream (or satellite) boundary occurs when the bias correction resets…
Problem Propogates Downward Glitches in 50mb raob temp bias at boundaries
So turn off the SSU channel 3 bias correction With Ch3 bias correction off Ch1&2 look better too Dee et al, “Importance Of Satellites For Stratospheric Data Assimilation”, 2007
Issue #2 CFSRR Radiosonde Radiation Correction (RC) Four separate operational tables used Creates discontinuities in temp analysis Interact with variational satellite bias corrections Highlights the need to use a continuous radiosonde correction in CFSRL, as in ERA, JRA, MERRA, etc.
Large change in (o-a) bias wrtradiosondes at 200mb over Asia in 1992
CFSRRR2 CFSRL RCOB-AN RCOB-OB RC table change in 1992 explains the jump
CFSRRR2 CFSRL But CFSR basically ignores the uncorrected radiosondeprior to 1992
CFSRRR2CFSRL Results different from R2 due to resolution and VBC’d radiances vs retrievals
CFSRRR2CFSRL Test of a simple adaptive correction for CFSRL Need to apply RAOBCORE type corrections also
Issue #3 Significant differences from other reanalyses In tropical tropospheric temperature
R1/R2 CFSR
20N-20S CFSRR Cold bias compared to radiosondes
CFSRR didn’t draw for the radiosonde temperature data in the tropics _________________________ Solution: adjust the GSI structure functions to increase the forecast variance in the tropical region, top to bottom __________________________ Analysis fits improved and large biases disappeared
CFSRL (solid lines) versus CFSRR (dotted lines) Analysis fits improved ____________________ Forecast fits not so much AN FC Diagram from Fanglin Yang
CFSRRR2 CFSRL RCOB-AN RCOB-OB Radiation correction not very large Poor initial fit in CFSRR gets better over time with observation density increase
CFSRRR2CFSRL CFSR analyzed sat radiance – R2 analyzed retrievals Must explain the opposite biases
CFSRRR2CFSRL New Radiosonde RC seems not to play much of a role in the CFSRL improvement here
Issue #4 QBO Wind Reversals Not Captured Well Discovered too late to fix in CFSRR Caught by surprise – not a problem in R1 or R2 Bogus ERA40 winds into CFSR QBO region Jul1981 - Dec1998
CFSR captured one transition (weakly) before bogusing began CFSR QBO improves after 1998 So bogusing ended
Problem seems to be due to overly narrow tropical FE structure function pre-1998 Single u component impact R2 CFSR
Inflated variance appears to solve problem in test run starting in May1994 U-comp wind Singaporeraobvsreanalysis10mb Inflated variance (SF*4) Original SF
However, zonal wind compared to Singapore ob shows the prx (SF*4) system still not capturing the wind phase shifts sufficiently in early 1980’s Large bias in 1982 easterly phase shift
Need additional work to fix the QBO • Is the SSU data interfering with the QBO wind analysis? • Damp the effect of SSU channels by raising ob errors. • How else can the impact of the data be increased? • Assimilate synoptic observations all day. • It turned out both of these measures had a similar positive effect on the QBO analysis, • but each at different levels
_ pry approach better at fitting the sparse 10mb data
_ IC bias
_ Initial bias removed for display
_ IC bias
_ Initial bias removed for display
_ IC bias
_ Initial bias removed for display
1982-1983 CFSRR
The End Thanks!
Reanalysis Comparisons with Singapore Winds (Means Diff and Diff Variability) 1982-1984 1998-1999
Adaptive RC procedure updated from R1 for CFSRL Each month the composite (F-O) statistics for temperature are computed for each WMO block (01-99) A profile of percentages of the (F-O) stats is defined as follows: pob>=700 tfrac=0pob==500 tfrac=.8*.333pob==400 tfrac=.8*.666pob< 400 tfrac=.8A data density factor is defined: ddf=min(1,cnt/15)A limiting factor is defined: abs(cor)<=tfrac*2.5Next months corrections in each block is: cor=(F-O)*tfrac*ddf. Finally the absolute value of the correction is limited to be <=tfrac*2.5.