Download
1 / 16
160 likes | 235 Views
Be Rational!. **EXPLAIN how you picked your answer. Extreme Exponents and Radical Radicals. Scientific Notation. What is the equation of the line graphed?. Slippery Slope. Which is the graph of y = 3x - 7?. A C. B D. Balance those Equations.

E N D
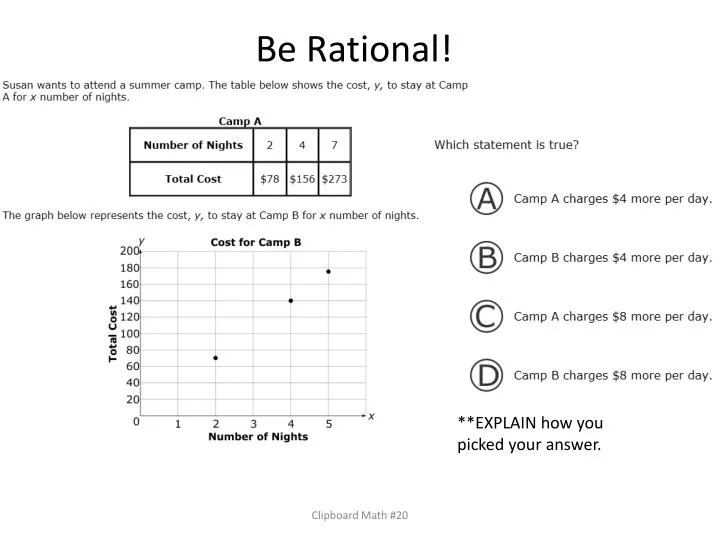
Be Rational! **EXPLAIN how you picked your answer. Clipboard Math #20
Extreme Exponents and Radical Radicals Clipboard Math #20
Scientific Notation What is the equation of the line graphed? Clipboard Math #20
Slippery Slope Which is the graph of y = 3x - 7? A C B D Clipboard Math #20
Balance those Equations What is the relationship between years of experience and income earned? • The income at 15 years and 25 years is the same. • The more years of experience a person has, the less the income. • The more years of experience a person has, the higher the income. • The income stays the same no matter how many years of experience. Clipboard Math #20
Two Variable Problems The graph shows the owl population in a city over several years. Using a linear model, which is the best estimate of the owl population in 2010? Clipboard Math #20
Funky Functions In which equation is y a nonlinear function of x? • y = ¼ x • y = - ½ x • y = -0.6x • y = x - 300 Clipboard Math #20
Modeling Relationships Which set of points are linear? ***Please show work to receive credit. Clipboard Math #20
Graph This! **EXPLAIN how you picked your answer OR show work. Clipboard Math #20
Transforming Transformations Write an equation of a line that has a slope of 5 and passes through the point (10, -15). ***Please show work to receive credit. Clipboard Math #20
Geometry Gems The graph represents temperature over time. Which scenario matches the graph? A cake is taken out of the oven and left on a table to cool. A pie is taken out of the freezer and is baking in the oven. A cold oven is preheating to a certain temperature. A warm oven is turned up to a higher temperature. Clipboard Math #20
Pythagorean Theorem The graph shows time vs. velocity over a 50-minute period. Which scenario would be best represented by the graph? • An object increases speed and then loses speed. • An object continues to move away from a starting point. • An object moves away from a starting point and then begins to come back. • An object increases speed, then moves at a constant rate, and then loses speed. Clipboard Math #20
Formula, Formula, Formula The perimeter of the rectangle below is 28 ft. What is the value of x? ***Please show work to receive credit. Clipboard Math #20
Scatterbrained Three times the difference of a number x and seven is twenty-three minus the sum of three times a number x and two. What is the value of x? ***Please show work to receive credit. Clipboard Math #20
Data, Data, Data Triangle STV is shown. What is the value of x? ***Please show work to receive credit. Clipboard Math #20
BONUS Triangle RST has vertices at R(3, 1), S(3, 5), and T(6, 5). What is the perimeter of triangle RST? ***Please show work to receive credit. Clipboard Math #20