Download
1 / 11
120 likes | 333 Views
*. *. IgG. IgG. JunB-2. JunB-3. JunB-4. JunB-5. JunB-2. JunB-3. JunB-4. JunB-5. JunB-1. JunB-1. *. *. IgG. IgG. JunB-2. JunB-3. JunB-4. JunB-5. JunB-2. JunB-3. JunB-4. JunB-5. JunB-1. JunB-1. *. *. *. IgG. IgG. JunB-2. JunB-3. JunB-4. JunB-5. JunB-2. JunB-3.

E N D
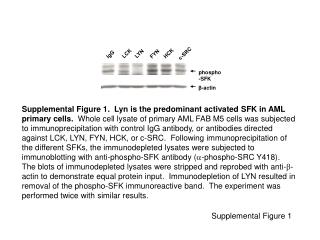
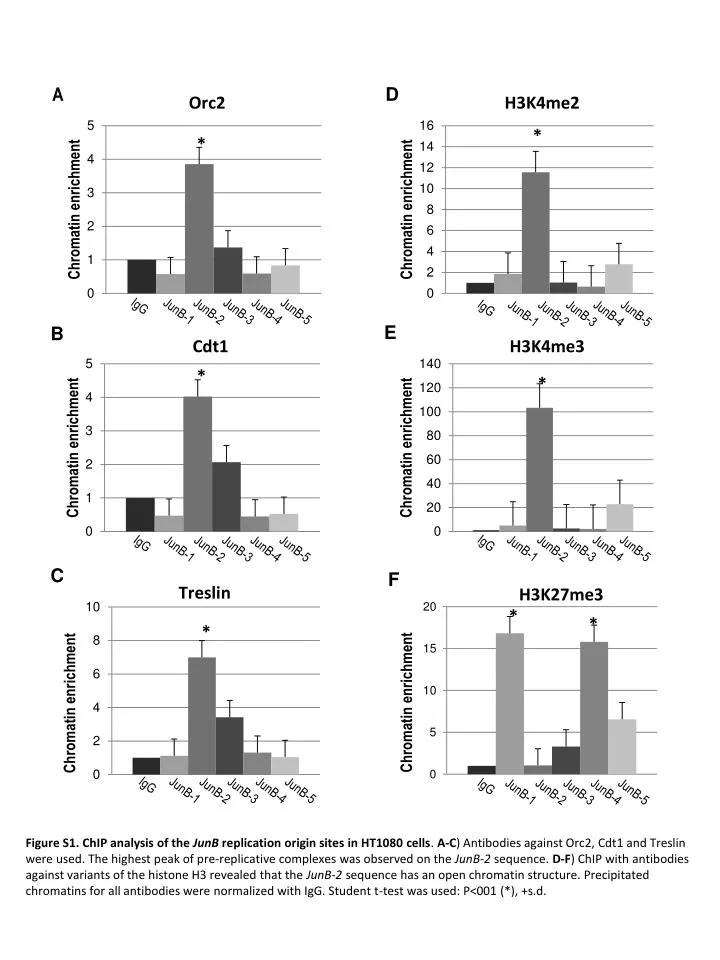
* * IgG IgG JunB-2 JunB-3 JunB-4 JunB-5 JunB-2 JunB-3 JunB-4 JunB-5 JunB-1 JunB-1 * * IgG IgG JunB-2 JunB-3 JunB-4 JunB-5 JunB-2 JunB-3 JunB-4 JunB-5 JunB-1 JunB-1 * * * IgG IgG JunB-2 JunB-3 JunB-4 JunB-5 JunB-2 JunB-3 JunB-4 JunB-5 JunB-1 JunB-1 Figure S1. ChIP analysis of the JunB replication origin sites in HT1080 cells. A-C) Antibodies against Orc2, Cdt1 and Treslin were used. The highest peak of pre-replicative complexes was observed on the JunB-2 sequence. D-F) ChIP with antibodies against variants of the histone H3 revealed that the JunB-2 sequence has an open chromatin structure. Precipitated chromatins for all antibodies were normalized with IgG. Student t-test was used: P<001 (*), +s.d.
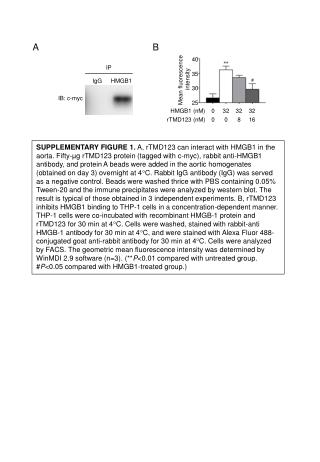
* * * IgG IgG cMyc cMyc 5SrDNA 5SrDNA ChrX-CEN ChrX-CEN * IgG cMyc 5srDNA ChrX-CEN Figure S2. ChIP analysis of the 5S rDNA replication origin site in HT1080 cells. A-C) Antibodies against variants of the histone H3 were used. ChrX-CEN corresponds to the chromosome X centromeric region that is not enriched for Orc2 and Treslin (see Fig. 6A,B). Student t-test was used: P<001 (*), +s.d.
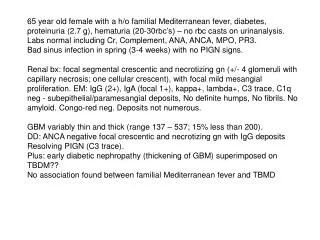
A tetO CENP-B Box YAC Bsr HT1080 tetO-HAC RCA vector 40kb 10kb tetO CENP-B Box Lox-P Bsr YAC MSC tetO-HAC-LoxP RCA vector 40kb ~15kb tetO CENP-B Box Bsr YAC VHL 786-0 tetO-HAC-VHL RCA vector 40kb ~65kb B * tetO Telomere Bsr YAC JunB-2 tetO-alphoid DAPI * * IgG Bsr YAC cMyc Bsr YAC JunB-2 tetO-alphoid tetO-alphoid
Figure S3.Mapping of origins of replication within the alphoidtetO HAC after its transferred into from HT1080 to different human cell lines. A) Origin of cell lines carrying the alphoidtetO HAC. The HAC was generated in HT1080 (Nakano et al., 2008). The HAC was retrofitted with the 5 kb loxP-cassette and transferred to human mesenhymal cells (MSC) (Iida et al. 2010). Then the human 55 kb VHL gene was inserted into the loxP site of the HAC and the HAC along with the gene was transferred to 786-0 renal carcinoma cells (Kim et al. 2011). The HACs in these cell lines were designated as tetO-HAC, tetO-HAC-LoxP and tetO-HAC-VHL. B) FISH analysis demonstrating that the alphoidtetO HAC remains circular after several rounds of MMCT transfer. Two probes were used: FITC-tetO for the alphoidtetO array (in green) and Cy3-telomere for the telomere sequences (in red). C, D) Nascent strand DNA abundance assay to map positions of replicators within the HAC sequences in MSC and 786-0 cell lines. E) ChIP analysis demonstrating open chromatin structure in the Bsr sequence in the tetO-HAC-VHL propagated in 786-0 cells. Student t-test was used: P<001 (*), +s.d.
* * Bsr Bsr YAC YAC JunB-2 JunB-2 tetO-alphoid tetO-alphoid D * Bsr YAC JunB-2 tetO-alphoid Figure S4.Mapping of origins of replication within the alphoidtetO arrays integrated into chromosomes in HT1080 cells. Three integrations of the array, each ~1 Mb in size, AB2-2-2, AB2-5-23 and AB-2-5-30, with no evidence of kinetochore assembly [based on the absence of CENP-A (see Figure S4D)] were used for the analysis. A-C). Real time PCR-based nascent DNA enrichment assay to map origins of replication along the sequence of the arrays. D) ChIP analysis of the arrays using antibodies against CENP-A (CA), H3K4me2, H3K4me3, H3K9Ac and H3K9me3. Student t-test was used: P<001 (*), +s.d.
Figure S5. Computer analysis of alpha-satellite monomers present in the nascent strand DNA fraction isolated from K562 and MCF-7 cells. Graphs summarize the comparison of chromosome X-assigned alpha-satellite monomers DXZ1 with the published data of nascent strand DNA sequences. There are three functional CENP-B boxes in the HOR repeat unit of the chromosome X (positions 658-675, 1353-1370 and 1864-1881) and one mutant box (position 825-842). There is a correlation between sites of nascent-strand DNA enrichment and monomers that contain functional CENP-B boxes.
IgG Pool siRNA-CENP-B JunB-nonORI JunB-nonORI JunB cMyc JunB cMyc JunB-nonORI JunB-nonORI JunB cMyc JunB cMyc Figure S6. Depletion of CENP-B in HT1080 cells. A-D). ChIP-qPCR with antibodies against Treslin, Orc2, H3K4me2 and H3K27me3. The level of JunB and cMyc sequences was quantified using a set of specific primers (Table S1). No effect of CENP-B depletion was detected for those chromosomal regions.
A Inter Origin Distance (kb) B C Chromosome 5 (D5Z1) Chromosome 5 (D5Z2) * * Transcription level Transcription level - control - control Si-Pool Si-Pool Si-CENPB Si-CENPB Figure S7. Analysis of centromeric regions in CENP-B-depleted cells. A – Measuring of inter-origin distances within alphoid DNA arrays after depletion of CENP-B. Replication origins were determined by the pattern of IdU-blue and CldU-red signals as described in Fig. 5. Alphoid DNA arrays were probed with biotinylated alpha-satellite consensus probe. The inter-origin distances on centromeric repeats in CENP-B-depleted cells were not distinguishable from those in control cells. B – Transcription level of HOR at chromosome 5, block D5Z1, in control cells. i.e. after treatment of siRNA pool and without any treatment. C – Transcription level of HOR at chromosome 5, block D5Z2, in cells with depletion of CENP-B and controls. qRT-PCR analysis with two pairs of specific primers was used to evaluate effect of CENP-B depletion on the transcription level of two well-characterized HORs in chromosome 5. For details see material and methods and Table S1.
Supplementary Table S3. Analysis of PCR products amplified by the primers designed from consensus alpha-satellite sequence* ___________________________________________________________________________ Clone Homology to HOR Chromosome ___________________________________________________________________________ - 1 D12Z3 12 - 2 D6Z1 6 - 3 D3Z1 3 - 4 D1Z7** 1, 5, 19 - 5 D1Z7 1, 5, 19 - 6 D6Z1 6 - 7 D1Z7 1, 5, 19 - 8 D1Z7 1, 5, 19 - 9 D1Z7 1, 5, 19 - 10 D16Z2 16 ____________________________________________________________________________ * PCR products were cloned into TOPO vector and sequenced using M13 primers. Sequences of ten randomly chosen clones were compared with a published complete sequence representation of alpha-satellite monomers across centromeric regions of human chromosomes (27). The analysis revealed sequences identical to HORs of seven chromosomes, that corresponds to ~12% of the diploid combines arrays. **D1Z7, a satellite array that is near-identical across three chromosomes.