Download
1 / 24
260 likes | 298 Views
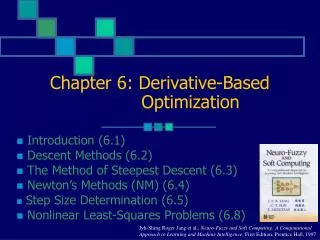
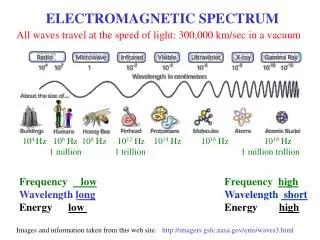
3.3.3 Derivative-based operators to remove low-frequency artifacts. Continuous-time signals:. Differentiation HPF (highpass filtering). L [d/dt] = s. dx (t)/dt. x (t)dt. X(t). X(t). H(f). H(f). Integration L PF (lowpass filtering). dt = 1/s. |H(f)|. |H(f)|. f. f.

E N D
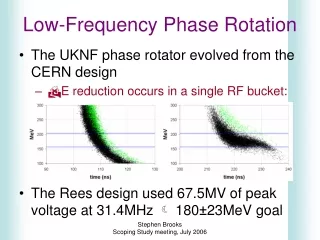
3.3.3 Derivative-based operators to remove low-frequency artifacts
Continuous-time signals: Differentiation HPF (highpass filtering) L[d/dt] = s dx(t)/dt x(t)dt X(t) X(t) H(f) H(f) Integration LPF (lowpass filtering) dt = 1/s |H(f)| |H(f)| f f
Discrete-time signals: Difference HPF Z[x(n) - x(n-1)] = (1 - z^-1) X(z) y(n) = [x(n) – x(n-1)]/T, T = sampling frequency x(n) + x(n-1) y(n) x(n) X(n) H(z) H(z) Z[x(n) + x(n-1)] = (1 + z^-1) X(z) Summation LPF (lowpass filtering) |H(f)| |H(f)| f f
Matlab command: freqz In MatLab, Normalized with respect to fs/2 Normalized with respect to fs
ECG signal with baseline drift (, and high-frequency noise) What we want:to eliminate the baseline drift. Baseline drift In this section, three derivative-based operators will be introduced. They are Filter 1, Filter 2, & Filter 3.
Filter 1: First-order difference operator Difference HPF Z[x(n) - x(n-1)] = (1 - z^-1) X(z) y(n) = [x(n) – x(n-1)]/T, T = sampling frequency y(n) x(n) H(z)
How to generate pole-zero plot in Matlab (1. Use “Matlab help” (2. Search “pole-zero plot” (3. Choose “zero-Pole Analysis” (4. Use “fvtool” Example: Fvtool([1 -1],[1])
Filter 1: First-order difference operator >>help freqz [H,F] = FREQZ(B,A,N,Fs) and [H,F] = FREQZ(B,A,N,'whole',Fs) return frequency vector F (in Hz), where Fs is the sampling frequency (in Hz). B = [1 -1]; A = [1]; freqz(B,A,200,1000)
Filter 1: frequency response Frequency: f(T) < f(P) < f(QRS) < f(noise) Amplification: A(T) < A(P) < A(QRS) < A(noise) QRS (17 Hz) P (5.6Hz) T (4.5 Hz) High-frequency noise Baseline drift Any problem in phase response? No, because of phase linearity Figure 3.22
Filter 1: the output Figure 3.24 Why do P and T waves disappear? What is the gain for them?
Filter 2: How to attenuate HF as well as LF noise y3(n) x(n) H3(z) [H3 w3] = freqz([1/2,0,-1/2])
Filter 2 --- frequency response [H3 w3] = freqz([1/2,0,-1/2])
Filter 2 frequency response High-frequency noise Figure 3.23
Filter 2 the output Figure 3.25
Filter 3 y(n+1) = x(n+1) - x(n) + 0.995 * y(n) y(n) = x(n) - x(n-1) + 0.995 * y(n-1)
Filter 3: Figure 3.26
Filter 3 frequency response Figure 3.27
Filter 3 the output Figure 3.28