Download
1 / 11
110 likes | 196 Views
CCE measurements with Epi-Si detectors. V. Cindro, G. Kramberger , I. Mandić, M. Mikuž, M. Zavrtanik, Jo žef Stefan Institute, Ljubjana, Slovenia G. Lindstr öm, E. Fretwurst, University of Hamburg V. Konomenkov INFN Padova.

E N D
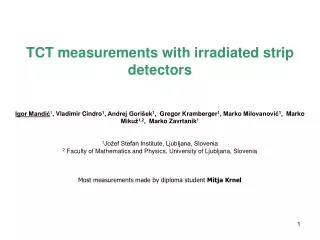
CCE measurements with Epi-Si detectors V. Cindro, G. Kramberger, I. Mandić, M. Mikuž, M. Zavrtanik, Jožef Stefan Institute, Ljubjana, Slovenia G. Lindström, E. Fretwurst, University of Hamburg V. Konomenkov INFN Padova G. Kramberger, Position Sensitive TCT Measurements with 3D-stc detectorsJun. 25-28, 2006, Prague
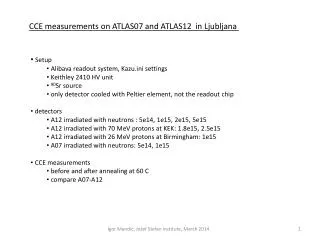
Motivation • CCE measurements with heavily irradiated n-type silicon detectors: • 50 mm epi-Si detectors processed by CiS: 50 Wcm (p & n irradiated) • 75 mm epi-Si detectors processed by CiS: 50 Wcm,150 Wcm standard and diffusion oxygenated (n irradiated) • 150 mm epi-Si detectors processed by IRST: 500 Wcm (n irradiated) NEW • Why? • to see if the Vfd makes any sense as a relevant parameter at high fluences • to be able to extract trapping times at fluences where TCT fails • to see how much charge can we collect at such high fluences with LHC speed elec. G. Kramberger, Position Sensitive TCT Measurements with 3D-stc detectorsJun. 25-28, 2006, Prague
Tex2440 Amplifier +shaper pad detector 90Sr/241Am thermal isolation cold plate scintillator Peltier cooler water cooled heat sink Setup (I) trigger signal is possible only for electrons passing through diode ~98% purity assures good measurements also at low S/N<1 ~25 ns • DAQ chain (rate to disk ~ 50 Hz) • ORTEC 142B preamplifier • custom made shaping amp. (~25 ns) • Tex 2440 oscilloscope connected to PC • Properties • Peltier cooling up to T=-30oC (stable to 0.1oC) • HV (bias) up to 5 kV • Full computer control (automatic scans) G. Kramberger, Position Sensitive TCT Measurements with 3D-stc detectorsJun. 25-28, 2006, Prague
Setup (II) Source Source support tube Detector mounting position Photo-multiplier+ scintilator pre-amplifier Cold plate (Peltier cooled) (water cooled back side) G. Kramberger, Position Sensitive TCT Measurements with 3D-stc detectorsJun. 25-28, 2006, Prague
Setup (II) - Calibration epi-Si detectors Average and most probable signal vs. detector thickness epi-Si 150 mm Scale calibrated with photons from 241Am (59.6 keV) nirr. Feq=6x1014 cm Example of energy loss spectra Trigger inefficiency on 2-3% level G. Kramberger, Position Sensitive TCT Measurements with 3D-stc detectorsJun. 25-28, 2006, Prague
CV measurements G. Lindström et al. 300 min @ 40oC neutron irradiated for 50 mm thick diodes and 50 Wcm n irr. From annealing plots -> no SCSI ! (introduction rate of donors>acceptors) for 75 and 150 mm thick diodes (150,500 Wcm) What about the SCSI ? • Vfd(150 mm)/Vfd(75 mm)~4 • if Neff≠constant it is interesting that the • additional oxygenation doesn’t help for neutron irradiation G. Kramberger, Position Sensitive TCT Measurements with 3D-stc detectorsJun. 25-28, 2006, Prague
Lower fluences show annealing behavior typical for n type detector ! |gc|~7x10⁻³ cm-1 Measurements performed so far on 50 Wcm epi-Si detectors show no inversion after neutron irradiation – also for the highest fluence the Vfd rises during “beneficial annealing” What about alpha particle measurements? G. Kramberger, Position Sensitive TCT Measurements with 3D-stc detectorsJun. 25-28, 2006, Prague
Alpha particle measurements 75 mm thick 50 Wcm epi-Si detectors after long term annealing (>2 years @20C)! n irradiated p irradiated 2· 1015 cm-2 Vfd=45V 2.17·1015 cm-2 Vfd=115V SCSI during annealing No SCSI Difference in field profile n irradiated 75 mm diode 6·1015 cm-2 Vfd=205V The detector is effectively of p-type SCSI after irradiation G. Kramberger, Position Sensitive TCT Measurements with 3D-stc detectorsJun. 25-28, 2006, Prague
M.I.P. measurements Vfd is denoted by short line for every sensor! Epi 150 T=-10oC Epi 75 75 mm diodes perform superbly in term of noise (no break downs) also at very high fluences! • kink in charge collection plot coincides with full depletion voltage from CV measurements! Also for heavily irradiated silicon detectors the full depletion voltage has meaning • the signal for heavily irradiated sensors rises significantly after Vfd (trapping) • >3200 e for 8x1015 cm-2 neutron irradiated sensor! – more than expected G. Kramberger, Position Sensitive TCT Measurements with 3D-stc detectorsJun. 25-28, 2006, Prague
M.I.P. measurements • Each measurement point was simulated (Vfd, V as for measurements, constant Neff) • Trapping times taken as “average” of measurements of several groups • T=-10oC • At lower fluences the simulation agrees well with data, at higher fluences the simulation underestimates the measurements • What would be the reason? – very likely trapping probabilities are smaller than extrapolated (~ 40-50% smaller) G. Kramberger, Position Sensitive TCT Measurements with 3D-stc detectorsJun. 25-28, 2006, Prague
Conclusions • CCE measurements were performed on new epi-Si detectors (75 and 150 mm thick) • after neutron irradiation the new sensors are effectively of p-type (Vfd annealing, a signals) • at 8x1015 cm-2 the most probable signal of mip for 75 mm thick device >3200 e • the kink in CCE vs. voltage coincides with Vfd ! Vfd is still a relevant parameter at very high fluences! • The signal is underestimated by simulations at high fluences -> smaller trapping probabilities than extrapolated! At lower fluences the simulation agrees well with measurements. G. Kramberger, Position Sensitive TCT Measurements with 3D-stc detectorsJun. 25-28, 2006, Prague