Download
1 / 26
270 likes | 288 Views
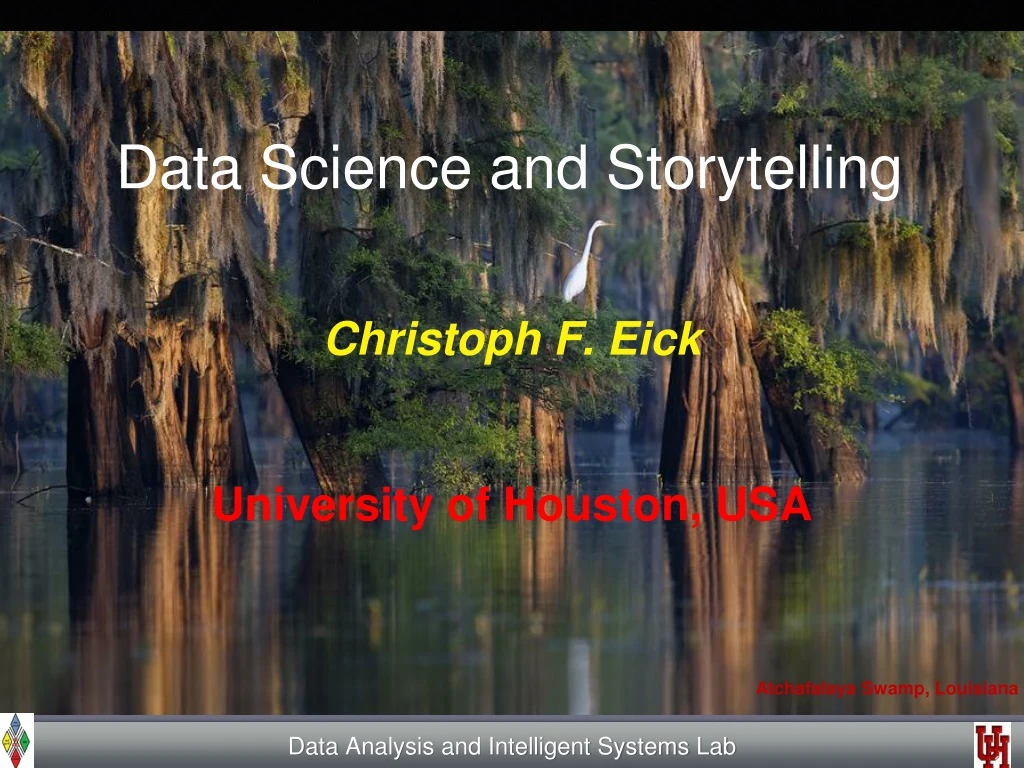
Data Science and Storytelling. Christoph F. Eick University of Houston, USA. Atchafalaya Swamp, Louisiana. Data Analysis and Intelligent Systems Lab. Talk Outline. Importance of Data Science Data Storytelling Examples of Data Storytelling Responsibilities of a Data Scientist

E N D
Data Science and Storytelling Christoph F. Eick University of Houston, USA Atchafalaya Swamp, Louisiana Data Analysis and Intelligent Systems Lab
Talk Outline • Importance of Data Science • Data Storytelling • Examples of Data Storytelling • Responsibilities of a Data Scientist • Conclusion Data Analysis and Intelligent Systems Lab
Already discussed 1. Importance of Data Science • “It is a capital mistake to theorize before one has data.”- Arthur Conan Doyle, Author of Sherlock Holmes • If you’re a scientist, and you have to have an answer, even in the absence of data, you’re not going to be a good scientist.” – Neil deGrasse Tyson, Astrophysicist • “Without big data analytics, companies are blind and deaf, wandering out onto the Web like deer on a freeway.” – Geoffrey Moore, Partner at MDV Data Analysis and Intelligent Systems Lab
2. Data Science and Storytelling • “Data scientists are involved with gathering data, massaging it into a tractable form, making it tell its story, and presenting that story to others.” – Mike Loukides, VP, O’Reilly Media • “Our challenge as data scientists is to translate this haystack of information into guidance for staff so they can make smart decisions…We “humanize” the data by turning raw numbers into a story about our performance. Data scientists want to believe that data has all the answers. But the most important part of our job is qualitative: asking questions, creating directives from our data, and telling its story. ” Jeff Bladtandand Bob Filbin Data Analysis and Intelligent Systems Lab
Data Science and Storytelling 2 • Google’s Chief Economist Dr. Hal R.Varianstated, "The ability to take data—to be able to understand it, to process it, to extract value from it, to visualize it, to communicate it—that’s going to be a hugely important skill in the next decades." • “When hiring data scientists, people tend to focus primarily on technical qualifications. It’s hard to find candidates who have the right mixof computational and statistical skills. But what’s even harder is finding people who have those skills and are good at communicating the story behind the data.” Michael Li Data Analysis and Intelligent Systems Lab
Ingredients of Good Data Science Story Telling • Data visualization expert Stephen Few said, “Data storytelling is a structured approach for communicating data insights, and it involves a combination of three key elements: data, visuals, and narrative”. Data Analysis and Intelligent Systems Lab
Ingredients of Good Data Science Story Telling 2 • It’s important to understand how these different elements combine and work together in data storytelling. • When narrative is coupled with data, it helps to explain to your audience what’s happening in the data and why a particular insight is important. Ample context and commentary is often needed to fully appreciate an insight. • When visuals are applied to data, they can enlighten the audience to insights that they wouldn’t see without charts or graphs. Many interesting patterns and outliers in the data would remain hidden in the rows and columns of data tables without the help of data visualizations. • Finally, when narrative and visuals are merged together, they can engage or even entertain an audience. When you combine the right visuals and narrative with the right data, you have a data story that can influence and drive change. Data Analysis and Intelligent Systems Lab
6 Ways to Enhance your Data Storytelling Skills (proposed by Tyler Byers, Comverge, Inc.) • Read as much as possible.. Human connection is critical to effective storytelling. • Write as much as possible. Writing provides clarity to your thoughts. You will ask better questions. • Find your voice. Don’t be afraid of saying “I” in your blog posts. • Visualizations First:The words you write or say should be meant to add context to your visualizations. • Listen to stand-up comedy. • Know your audience • Know your Audience: Data Analysis and Intelligent Systems Lab
skip Aristotle’s Contribution Aristotle’s classic five-point plan to create a persuasive argument: 1. Deliver a story or statement that arouses the audience’s interest. 2. Pose a problem or question that has to be solved or answered. 3. Offer a solution to the problem you raised. 4. Describe specific benefits for adopting the course of action set forth in your solution. 5. State a call to action. Data Analysis and Intelligent Systems Lab
skip Steps to Create a Data Story by Shantanu Kumar • Begin with a Pen-Paper Approach following Aristotle’s plan • Dig deeper to identify the sole purpose of your story • Use powerful headings • Design a road-map • Conclude with brevity Source: https://dzone.com/articles/the-art-of-story-telling-in-data-science-and-how-t Data Analysis and Intelligent Systems Lab
Storyboarding (Source UC Berkeley GSJ) The first step to creating a data story is storyboarding it. Source: https://multimedia.journalism.berkeley.edu/tutorials/starttofinish-storyboarding/ A storyboard is a sketch of how to organize a story and a list of its contents. A storyboard helps you: • Define the parameters of a story within available resources and time • Organize and focus a story • Figure out what medium to use for each part of the story Data Analysis and Intelligent Systems Lab
Storytelling and TED Talks (observed by Carmine Gallow) • Modern-day storytelling is often associated with the popular TED conference series and its slogan of “Ideas Worth Spreading.” Sandberg had realized that the best way to connect with people on an emotional level is through the power of story. In my analysis of 500 of the most popular TED talks (more than 150 hours), I discovered a remarkable fact: stories make up at least 65% of the content of the most successful TED presentations. In some cases, like Sheryl Sandberg’s talk, stories make up more than 70 percent of the content. • A popular TED speaker, Brené Brown, has noted, “Stories are just data with a soul.” • Most leaders who make pitches and presentations take the opposite approach, filling their content with mind-numbing and unemotional statistics and data. Data Analysis and Intelligent Systems Lab
3. Data Storytelling Examples: Science Magazine Contest The 2017 Data Stories Contest saw submissions from around the world that tackled everything from wound healing to radioactive exposure to changing landscapes. Below are our winners in the student, professional, and corporate entity categories, as well as your pick for the People’s Choice award! In 2017 there was • A student winner • A professional winner • A cooperate winner • A people’s choice • Results: http://www.sciencemag.org/projects/data-stories/winners/2017 Data Analysis and Intelligent Systems Lab
2017 Student Winner Video by Kate Bredbenner: Title "Wait... How Many People Died?" This video demonstrates how stop animation and simple graphics can be very effective tools to communicate statistical information in a fun and fresh way. The fact that the video has an agile script and a solid data foundation liberates the author from needing sophisticated graphics in order to communicate clearly. Video URL: https://youtu.be/YCATvQiLj68 Data Analysis and Intelligent Systems Lab
2017 Professional Winner by Gregory Shirah "Seasonal Changes in Carbon Dioxide" What makes this visualization stand out in a plethora of similar graphics is the departure from the typical flat representation of the data by adding a third dimension to explain the flow of carbon dioxide in different altitudes. The author brilliantly uses this extra layer of information by integrating it into the narrative of the video and playing with different angles to convey a fascinating story. Video URL: https://youtu.be/X2TOrKdJsqs Data Analysis and Intelligent Systems Lab
Story Telling Examples2: Hans Rosling and Gap Minder • Hans Rosling(27 July 1948 – 7 February 2017) was a Swedish physician, academic, statistician, and public speaker. He was the Professor of International Health at KarolinskaInstitute. He held presentations around the world, in which he promoted the use of data to explore development issues. • In Hans Rosling’s hands, data sings. Global trends in health and economics come to vivid life. And the big picture of global development—with some surprisingly good news—snaps into sharp focus. https://www.ted.com/speakers/hans_rosling • Hans Rosling and his collaborator’s created Gapminder; an organization that centers on producing sophisticated graphics and visualization tool for data story telling. Gapminder is also committed to educate the public about the social problems in the world. (www: https://www.gapminder.org/) Data Analysis and Intelligent Systems Lab
Bubble Charts and Adding a Story to It • Gap Minder: https://www.gapminder.org/tools/#_data_/_lastModified:1521732308820;&chart-type=bubbles • Video: https://www.ted.com/talks/hans_rosling_asia_s_rise_how_and_when (start at 6:37 (year 1930) until 10:30a of video steam) Bubble Chart Data Analysis and Intelligent Systems Lab
4. Resposibilities of Data Scientists 1. We have to have some committment to tell the truth „Torture the data long enough and it will confess to anything."Nobel Prize winning economist Ronald Coase “To find signals in data, we must learn to reduce the noise - not just the noise that resides in the data, but also the noise that resides in us. It is nearly impossible for noisy minds to perceive anything but noise in data.” ― Stephen Few, Signal: Understanding What Matters in a World of Noise 2. We have to know what we are doing Data Analysis and Intelligent Systems Lab
Example: Not knowing what we are doing—Spurious Correlations • Consumption of Ice Cream and Drowning in Swiming Pools are highly correlated. Data Analysis and Intelligent Systems Lab
Spurious Correlations 2 Correlation 99.26% Correlation: 95.45% Data Analysis and Intelligent Systems Lab
Spurious Correlations 3 Correlation 95.24% Data Analysis and Intelligent Systems Lab
Data Science is More than Using Tools • The problem with data is that it says a lot, but it also says nothing. ‘Big data’ is terrific, but it’s usually thin. To understand why something is happening, we have to engage in both forensics and guess work.”- Sendhil Mullainathan, Professor of economics, Harvard • “But a theory is not like an airline or bus timetable. We are not interested simply in the accuracy of its predictions. A theory also serves as a base for thinking. It helps us to understand what is going on by enabling us to organize our thoughts. Faced with a choice between a theory which predicts well but gives us little insight into how the system works and one which gives us this insight but predicts badly, I would choose the latter, and I am inclined to think that most economists would do the same.” ― Ronald H. Coase, Essays on Economics and Economists Data Analysis and Intelligent Systems Lab
Theories/Models that Predict Well:Deep Neural Networks Data Analysis and Intelligent Systems Lab
Models that Tell Us What is Going On Example: Decision Tree Learnt from a Pima Indian Diabetes Dataset Variables:b=blood sugar level, f=BMI,h=age,a=#pregnancies Example Rule: If 127<b<157 and f<29.9 then Not Diabetes Data Analysis and Intelligent Systems Lab
5. Conclusion I hope I convinced that data science is not only about using fancy deep learning and other tools, but • Knowing what we are actually doing or using and understanding the limitations and assumptions of the employed approaches and tools • Selecting “the best” visualization and knowing how to use visualization tools properly • Transforming data analysis results into actionable knowledge • Capabilities to integrate our findings/research into the bigger picture • and last, but not least: data storytelling are equally important skills. Data Analysis and Intelligent Systems Lab
Data Science According to Swami Chandrasekaran Talk Outline • Importance of Data Science • Data Science is More than Using Tools • Data Storytelling • Examples of Data Storytelling • Conclusion Data Analysis and Intelligent Systems Lab