Download
1 / 21
210 likes | 328 Views
Calculating Return on Investment for Fleet Sustainability Initiatives. Scott DeWees 3/13/13. Cash Flow Analysis. Evaluates a scenario where cash flow is altered. Green fleet examples: A vehicle is equipped with Start-Stop technology at an additional cost

E N D
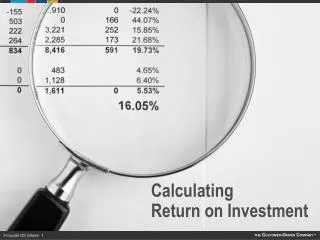
Calculating Return on Investment for Fleet Sustainability Initiatives Scott DeWees 3/13/13
Cash Flow Analysis • Evaluates a scenario where cash flow is altered. Green fleet examples: • A vehicle is equipped with Start-Stop technology at an additional cost • An alternative fuel vehicle is being compared to a traditional OR an alt-fuel up-fit is being contemplated
Does It Pencil? • Many cash flow metrics available to determine the value of a project • No single metric tells the whole story • EX: ROI, IRR, NPV, TCO, Payback period
Questions Cash Flow Analysis Can Answer • A fleet anticipates a cost saving in the future, what is it worth today? - use NPV • A fleet has a choice between two vehicles, both provides lower ownership costs? - use IRR • Also useful in setting or testing lease chargeback rates
Simple Return • Net cash flow at the end of the term, not corrected for inflation or present value. • Bottom line: easily and quickly interpreted but lacks important information
Return on Investment • The net cash flow described as a percentage of the original investment at the end of the term. • Bottom line: ROI accounts for the benefits of an investment relative to the cost, but lacks important information. Allows an inherent element of comparison among multiple scenarios
Net Present Value • The net cash flow at the end of a term, adjusted for risk and opportunity cost • Bottom line: NPV is likely your best single tool for evaluating an investment, but it isn't perfect. • EX: Two investments with similar NPV’s could have different risk, or different investment costs. • NPV requires and accurate discount rate
Net Present Value: The Discount Rate Establishing the right discount rate can be tough. Easiest to start with Interest.
Internal Rate of Return • Also known as the hurdle rate. IRR describes the maximum discount rate (or cost of borrowing) able to break even on a project. • EX: you could borrow up to 11.4 percent and still break even on investment A • Higher IRR is typically better • Note: I’ve setup this example to make IRR and NPV to disagree about which is “Better”
Payback Period • The period of time before the investment breaks even • Poor representation of changing cash flows
How To Perform Cash Flow Analysis • A: The hard/Important part is understanding future costs and benefits • Operational costs/savings over time • Residual value of a asset/investment • Forecasting changing business climates (like future costs of fuel/maintenance) • B: Construct a cash flow model in Excel
Resources for Inputs to The Model • Fuels: • Alternative fuels: http://www.afdc.energy.gov/fuels/prices.html • Traditional fuels, historic and forecasts: http://www.eia.gov/petroleum/ • EIA’s STEO: http://www.eia.gov/forecasts/steo/report/prices.cfm • Vehicles + Misc: • Idaho National Labs Advanced Vehicle Testing Activity : http://avt.inel.gov/index.shtml • Mercury associates articles: http://www.mercury-assoc.com/resources/articles.aspx • NREL case studies:
Converting vehicle operation into an “investment” format Step Two: compare initial and operational costs. Treat net costs as negative, and net savings as positive. Step One: TCO estimate