Download
1 / 32
320 likes | 556 Views
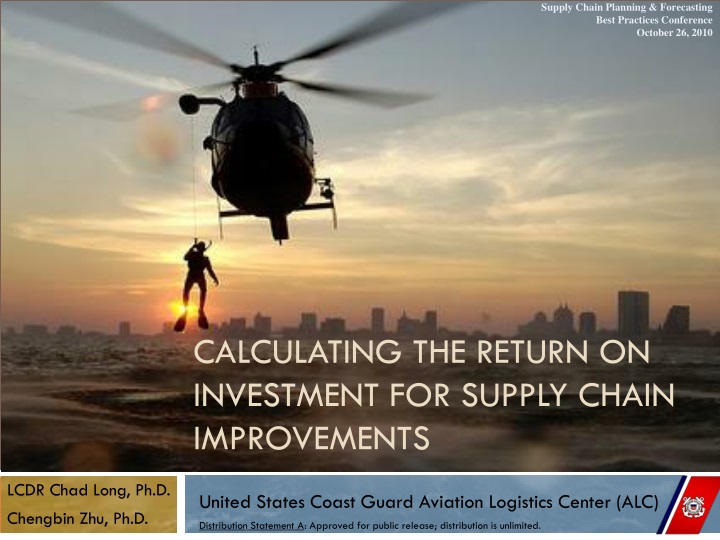
Supply Chain Planning & Forecasting Best Practices Conference October 26, 2010. Calculating the Return on Investment for Supply Chain Improvements. LCDR Chad Long, Ph.D. Chengbin Zhu, Ph.D. United States Coast Guard Aviation Logistics Center (ALC).

E N D
Supply Chain Planning & Forecasting Best Practices Conference October 26, 2010 Calculating the Return on Investment for Supply Chain Improvements LCDR Chad Long, Ph.D. Chengbin Zhu, Ph.D. United States Coast Guard Aviation Logistics Center (ALC) Distribution Statement A: Approved for public release; distribution is unlimited.
Agenda • Coast Guard Background • ALC Supply Chain Background • Return on Investment Study • Background • Methodology • Final Metric • Costs • Conclusion
Coast Guard Background • Commissioned 10 cutters in 1790 • Department of Treasury • Revenue Cutter Service • Life Saving Service • Lighthouse Service • Bureau of Marine Inspection and Navigation • Department of Transportation • Department of Homeland Security Distribution Statement A: Approved for public release; distribution is unlimited.
Coast Guard Background • Maritime Safety • Maritime Security • Maritime Mobility • National Defense • Protection of Natural Resources Distribution Statement A: Approved for public release; distribution is unlimited.
Supply Chain Background As of September 2010 Port Angeles 3 MH-65C • North Bend • HH-65CAirfac Newport Cape Cod 4 HU-25 4 MH-60T Astoria 3 HH-60J Detroit 5 HH-65CAirfac Muskegon Humboldt Bay 3 HH-65C Traverse City 5 HH-65CAirfac Waukegan Atlantic City 10 MH-65C 1 HH-65D NCR Sacramento 4 HC-130H San Francisco 4 MH-65C Washington 1 C-37A 1 C-143A Los Angeles 4 HH-65C Savannah 5 HH-65CAirfac Charleston Elizabeth City 5 C-130J 5 MH-60J San Diego 3 MH-60J • ALC • PDM Line • 7 HC-130H • 1 HC-130J • 9 HU-25 • 8 MH-60J • 11 MH-65C • 2 C-144A HITRON 9 MH-65C • Kodiak • 4 HC-130H • 4 MH-60J • HH-65C • Airfac Cordova Barbers Point 4 HC-130H 4 HH-65C New Orleans 5 HH-65C Clearwater 6 HC-130H 8 MH-60J Sitka 3 HH-60J Miami 4 HU-25 5 HH-65C 3 HC-144A Mobile, AL Operations 5 HC-144A Training 2 HU-25 4 MH-60T 7 MH-65C 1 MH-65D Houston 3 MH-65C Corpus Christi 3 HU-25 3 HH-65C Borinquen, PR 4 HH-65C Distribution Statement A: Approved for public release; distribution is unlimited.
Supply Chain Background • 40,000 different parts in current inventory • Inventory value: $1.2 billion • Inventory contains many slow moving parts with intermittent demand • Annual spare parts budget of $222M (FY10) • Approximately 16% of parts account for 84% of the budget
Supply Chain Background • First-rate Analytics • Collaboration • Total Asset Visibility
Supply Chain Background • In 2008, the Coast Guard invested in a Supply Chain Management Solution (SCMS) • Standardize purchasing priority • Remove individual spreadsheet decision making • Reduce manual inputs • Use real time data • Global outlook
Return on Investment • Prior ROI research • ROI- Evaluation Framework • ROI Method • Project Objective • Evaluate Plan • Collecting Data • Evaluating Effects • ROI Calculations
Prior ROI research • Traditional ROI: • Emerging in 1920s • Evaluate the payoff of the investments • ROI= Net Benefit / Programs Cost • Source of Benefit: • Tangible benefits: Increase productivity, Cut cost,… • Intangible benefits: Customer service, job satisfaction, …
Prior ROI research • Problem with SCMS ROI: • Difficulty for SCMS ROI: • More Intangible Benefit: How well we improve the decision • Isolate the Effect of SCMS Project: SCMS structure is complicated • "Much of the evidence [for payoff] is anecdotal” - After a study of 861 companies
Prior ROI research • ROI Methodology: • Began in 1970s and Refined for Different Industries • A logical and Rational Approach for ROI Accountability Evaluation Framework Review Project Object Develop evaluation plan and baseline data Data Collection Isolate effects of Project Calculate ROI ROI Report
ROI - Evaluation Framework Measurement Focus Value of Information Level: Low 1. Reaction and Perceived Value Measures participants’ reaction to the project Questionnaires And Surveys Measures changes in the knowledge skills and attitudes related to technology 2. Learning and Confidence 3. Application and Implementation Measures changes in on-the-job action and progress with planned actions ALC Required in ROI analysis 4. Impact and Consequences Measures changes in business impact variables High Compares project monetary benefits to the project costs 5. Return on Investment
ROI Method – Project Object Demand Demand Functionality of SCMS: Inventory Control PART PART PART PART PART PART Coast Guard ALC Objects : Aircraft Availability : Cost • Maintenance Schedule • Workforce Training • Back Orders Reduction • …. With SCMS: Better Inventory Control Budget Without SCMS Budget Dollar Value impact Un-equivalent Inventory Deficiency • Transportation Cost • Repair Cost • Unnecessary Purchase • …. Excessive Inventory Latency Effect
ROI Method- Project Object • ALC Objects: • Reduce Cost • Improve Aircraft Availability • SCMS Project: • Better Inventory Control Decision • Contribution to ALC Object: • Less Excessive Inventory • Less Inventory Deficiency
ROI Method- Evaluate Plan • Data Items: • Reduction of Excessive Inventory in Dollar Value • Reduction of Inventory Deficiency in Dollar Value • Comparison between FY07 (before) and FY09 (after) • Requirement for Isolating Project Effect • Assuming the benefit will remain the same level during the whole project life time. • No Long Term Consideration • Reduction of Inventory Deficiency in Dollar Value • Independent of Budget, Initial Inventory and Demand
ROI Method- Collecting Data • Source of Data • Demand Data (FY07-FY09) • Purchase Data (FY07-FY09) • Inventory Position Data (end of years: FY06-FY09) • Lead Time Data (FY07- FY09) • Demand Forecasting Data (FY07- FY09) • Part Price Table (include repair & new buy) • Dollar Value Adjusted to FY09 (with inflation rate of 5.1%)
ROI Method- Isolating Effect • Excessive Inventory • Initial Idea: Compare the Change in Excessive Inventory • Definition of Excessive Inventory: • EIL = 2 Year Demand Forecasting+ Lead Time Demand +1 • Lead Time Demand = Annual Demand Forecasting* Lead Time/365 • EI = MAX(0, Inventory Position – EIL) * Unit Price (Repair Cost) • Result: Note: Cost are based on FY09 with an inflation rate of 5.1%.
ROI Method- Isolating Effect • Excessive Inventory • Why Excessive Inventory Increase • Four Source of Increase in Excessive Inventory • Initial Inventory Level • Demand • Budget • Inventory Control Policy Part of Initial Inventory is not controllable: caused by initial inventory and change in demand More Initial Inventory Stable Demand Note: Cost are based on FY09 with an inflation rate of 5.1%.
ROI Method- Isolating Effect • Isolate the Effect of Inventory Control • Excessive Inventory Caused by New Purchase (Repair) • EIN = MIN(New Purchase in the FY, EI) • Total EIN $= SUM EIN* $ Unit Price (Repair Cost) for all parts Inventory Position EIN Demand Excessive Level New Purchase Beginning of the year End of the year Time Inventory Position Note: Cost are based on FY09 with an inflation rate of 5.1%. Demand EIN New Purchase Excessive Level Beginning of the year End of the year Time
ROI Method- Isolating Effect • Inventory Deficiency • Threshold for Inventory Deficiency • Lead Time Demand • Why not Safety Stock - Affected by SCMS itself • Inventory Deficiency ID = MAX(0, Lead Time Demand - Inventory Position) * Unit Price (Repair Cost) Note: Cost are based on FY09 with an inflation rate of 5.1%.
ROI Method- Isolating Effect • Inventory Deficiency • Should We Exclude the effect of Budget, Demand and Initial Inventory • No, Because: • Budget plus initial inventory is always much more than Demand • All Inventory deficiencies are caused by inventory control decision
ROI Method- ROI Calculation • One year Benefit: • Benefit in FY09: (Total EIN $ (FY09)- Total EIN $(FY07)) + (ID $ (FY09)- ID $ (FY07)) • Project Benefits in Following Year: • Assume with new SCMS, each year generate similar amount of excessive inventory out of new purchase • Assume with new SCMS, each year reduce similar amount of inventory deficiency compared to without new SCMS • Total Benefit = n * Cost Saving in FY2009
Costs * FY10 is through March 31, 2010. Note: Cost are based on FY09 with an inflation rate of 5.1%. Total: $9,138,277
Calculations $M Note: Cost are based on FY09 with an inflation rate of 5.1%.
Calculations -3.4M $M -4.3M Note: Cost are based on FY09 with an inflation rate of 5.1%.
Calculations • SCMS costs of investment through March 31st, 2010: $9,138,277. • Excessive Inventory cost savings extrapolated to March 31st, 2010: $6,500,000. • Inventory Deficiency cost savings extrapolated to March 31st, 2010: $5,100,000. Time period for Cost Savings Time period for SCMS Cost Oct 1, 2006 Oct 1, 2009 Oct 1, 2010 Mar 31, 2010
ROI Formula ROI = (Cost Savings – Cost of Investment) Cost Of Investment ROI = ($11,600,000 – $9,138,277) $9,138,277 ROI = 27% over the original investment
Break Even Analysis Note: Cost are based on FY09 with an inflation rate of 5.1%. Distribution Statement A: Approved for public release; distribution is unlimited.
Conclusions • Coast Guard Improvement • Return on Investment calculation • Direct Benefits • Indirect Benefits • Questions? Distribution Statement A: Approved for public release; distribution is unlimited.