Download
1 / 22
220 likes | 304 Views
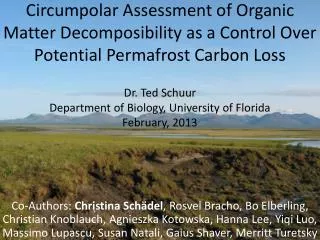
D.V. Khvorostyanov 1,2 , G. Krinner 2 , P. Ciais 1 , S.A. Zimov 3 1 Laboratoire des Sciences du Climat et l'Environnement, Gif-sur-Yvette, France 2 Laboratoire de Glaciologie et Géophysique de l'Environnement, St Martin d’Hères, France 3 Northeast Science Station, Cherskii, Russia.

E N D
D.V. Khvorostyanov1,2, G. Krinner2, P. Ciais1, S.A. Zimov3 1Laboratoire des Sciences du Climat et l'Environnement, Gif-sur-Yvette, France 2Laboratoire de Glaciologie et Géophysique de l'Environnement, St Martin d’Hères, France 3Northeast Science Station, Cherskii, Russia Vulnerabilityof frozen carbon
Continuous (90-100% area) Discontinuous (50-90% area) Sporadic (10-50% area) Isolated Patches (<10% area) • 22.8 millions km2or 23.9% NH land area • Continuous permaforst as far as 50-60oN to the northeast of Lake Baikal • 63% mainly in Siberia, Russian Far East, Northern Mongolia, Northeastern China Permafrost
Area decrease by 2050: • 12-22% all types • 12-34% continuous Anisimov&Nelson 1997 Permafrost melting Oelke et al, GRL 2004: Active layer depth increase 1980 – 2002
7.8 mln km2268 Gt (16%world soil organic C) Soil C estimates: top 1m only! NH Cryosols North America: 3.6 mln km2 (46%) 107 GtC (40%) Mean C content: 31 kgC m-2 Eurasia: 4.2 mln km2 (54%) 162 GtC (60%) Mean C content: 39 kgC m-2 Tarnocai et al, 2003
Yedoma Ice: Northeast Siberia 1-million km2 area of carbon-rich loess sediments Presumably400 GtC at mean depth of 12 m and 33 kgC m-3 density Alekseev et al, Soil Science Society of America Journal (2003) Zimov et al, Science 1997
Temperaturedependence of biomass decomposition Goulden et al (1998) measurements: permafrost thaw => 10-fold increased decomposition «One question, two answers» D.Powlson, Nature 2005 One C pool (Glardina&Ryan 2000) Three C pools (Knorr et al 2005)
Soil Model Processes Heat conduction with freezing/thawing Hydrology Soil carbon consumption Oxic decompostion Methanogenesis Methanotrophy Diffusion of O2 and CH4 Transfer of gases due to pressure difference Methane ebullition
Holocene configuration: comparison with observations • Methane fluxes • Cherskii, summer 2003
One point in Siberia... The region of interest is Northeast Siberia, but… • First we test the model sensitivity and study in some detail the key processes providing the feedback • These are local climate conditions that matter for this part of the study So we choose a point in the central southern Siberia but with soil configuration of Yedoma Ice
The surface forcing: 1000 + 1000 2xCO2 Present-day climate
Soil carbon balance Indefinite integrals over time: How much of the soil carbon has been transformed in one of these processes at a given time
Step forcing and soil response 3 types of simulations: No oxygen limitation on the oxic decomposition Oxygen limitation,no methane Methanogenesis and methanotrophy included
Step forcing and soil response Biomass decomposition and methanotrophy • …are accompanied by heat release to the soil • …occur without heat release
Model sensitivity analysis • Carbon (kgC m-2) • releasead since • the 2 CO2 warming • Accumulated surface • methane flux over • the same time
Sensitivity to respiration heat Threshold between 35 and 40 MJ kgC-1 Very small changes in consumed C elsewhere Methane fraction grows very slightly
Sensitivity analysis résumé Control soil respiration and heat transfer Control methanogenesis, methanotrophy
Simulations for the Yedoma Ice region About 2 GtC are consumed in the first 100 yrs, 4 GtC in 200 yrs
Conclusions The model reasonably simulates methane fluxes on seasonal timescales The carbon consumption time scale is about a few centuries in response to 2xCO2 forcing Decomposition heat releasecan be essential for the positive feedback between the global warming and frozen soil response Availability of oxygen, methanogenesis, and local climate conditionsdetermine its existence and parameters Model sensitivity is the largest with respect to the parameters determining soil heating, freezing/thawing, and respiration About 4 GtC are released in the atmosphere as CO2 in the first 200 years after the rapid 2xCO2 warming