Download
1 / 40
400 likes | 542 Views
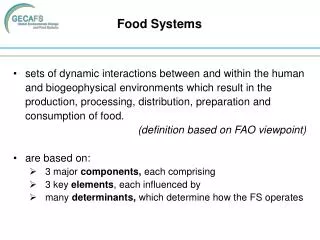
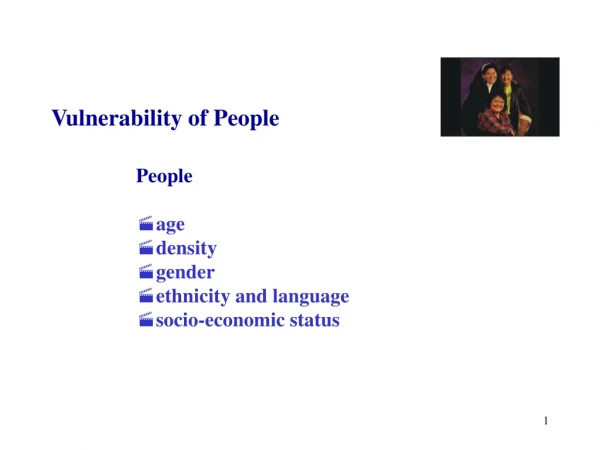
Vulnerability of Food Systems. IGP 2 (Site-Ludhiana). Issues. Estimating incidence and depth of food insecurity Examining determinants of food insecurity. Sample. Rural households were classified on the basis of land ownership Urban households were classified on the basis of income

E N D
Vulnerability of Food Systems IGP 2 (Site-Ludhiana)
Issues • Estimating incidence and depth of food insecurity • Examining determinants of food insecurity
Sample • Rural households were classified on the basis of land ownership • Urban households were classified on the basis of income • Total Sample: Rural areas 130 (from 3 villages representing 3 development blocks) • Urban Areas: Sample Size 132 (collected from different areas of Ludhiana city representing different income groups)
Method of Measurement • Incidence of food insecurity IFI=FIH/TH*100 IFI=Incidence of food insecurity FIH=No. of food insecure households TH=Total number of households • Depth of food insecurity was measured by estimating average food insecurity gap of food insecure households =(Σ(TCRi-TCCi)/TCRi)/FIH TCRi=Total calorie requirement for ith food insecure household TCCi=Total calorie consumption by ith food insecure household • Two way tables were constructed to identify the factors influencing food systems • LOGIT model may be used to identify and quantify the factors influencing the food insecurity
Land use pattern of Ludhiana district, 2003-04 Source: Economic and Statistical Organization, Government of Punjab, Chandigarh.
PRODUCER Consumer (15%) Primary Wholesalers (7.5%) Flour Mills (5%) Secondary Wholesalers Public Procurement Agencies (70-75%) Flour Mills Retailer Fair Price Shops Retailer CONSUMER Supply Chain for Wheat in Punjab
PRODUCER Consumer (1%) Millers (24-25%) Primary Wholesalers (7.5%) Secondary Wholesalers Public Procurement Agencies (75%) Public Agency (75%) Millers Flour Mills Wholesaler Fair Price Shops Retailer Retailer CONSUMER Supply Chain for Rice in Punjab
Supply Chain for Potatoes in Punjab POTATO PRODUCER 7 1 DISTANT MARKETS 2 6 Wholesaler / CA (Punjab) (afterstorage) Storage (Hired) 3 4 Wholesaler / Commission Agent Collector (works on the behalf of the commission agent or theWS of the distant market) 5 SubWholesaler (Phariwala) Processor Traders from other states Retailer Large /distant Market(Repackaging may also bedone) Farmer MAIN SUPPLY CHANNEL Consuming Markets Consumer SEED (60%) PROCESSED (10 - 15%) FRESH MARKET (25 - 30%)
FARMERS Contract Farming Secondary wholesaler From local market Processor Retailer CONSUMER Supply Chain for Green Peas in Punjab
TOMATO PRODUCER 5 1 Secondary wholesaler 4 Processor 2 3 Retailer Exports ( <1%) PROCESSING (14%) Consumer Distant Markets FRESH MARKET (86%) Supply Chain for Tomatoes in Punjab
FARMER 5 1 Consolidator 2 4 • Pre Harvest Contractor Distant Markets (farmer himself takes the produce to distant markets) 3 Local Markets (in bulk or after packaging) Local Market Distant markets (viz. Delhi, Calcutta, Bombay, Bangalore & Jammu) Wholesaler Retailer Small size produce after grading Consumer Consumer Small juicing plants Processor Supply Chain for Kinnow in Punjab
Price spread in food (Between producer and consumer) • Larger the producer share in consumer rupee, lower the price spread • Producer share in consumer rupee (%) -Wheat: Rural: 100%; Urban: 65-75% -Rice: Both: 60-70% -Pulses: 50-60% -Milk: Rural: 100%; Urban: 50-60% -Fruits and Veges: 25-35%
Incidence and Depth of Food Insecurity among Rural Households
Incidence and Depth of Food Insecurity among Urban Households
Component Wise Incidence and Depth of Food Insecurity among Rural Households I: Incidence, D: Depth of food insecurity
Distribution of rural households on the basis of self production and purchasing (%)
Component Wise Incidence and Depth of Food Insecurity among Urban Households I: Incidence, D: Depth of food insecurity