Download

1 / 21
210 likes | 282 Views
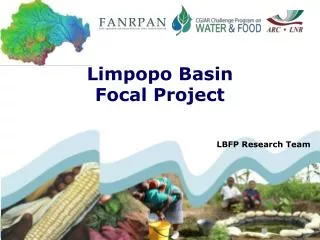
Water Poverty Analysis IGB Basin Focal project. Upali Amarasinghe, Stefanos Xenarios Rajendran Srinivasulu, Dhrubra Pant, Madar Samad. IGB Riparian countries has: 1.3 billion people in 2000 380 million (29%) are poor 942 million (72%) rural population 340 million (36%) are poor.

E N D
Water Poverty Analysis IGB Basin Focal project Upali Amarasinghe, Stefanos Xenarios Rajendran Srinivasulu, Dhrubra Pant, Madar Samad
IGB Riparian countries has: 1.3 billion people in 2000 380 million (29%) are poor 942 million (72%) rural population 340 million (36%) are poor BFP: Water-Poverty Analysis Setting the Context • IGB has: • 605 million people • 191 million (32%)are poor • 454 million (75%)rural populatio • 151 million (33%)are poor Poverty is a rural phenomena
A major part of the poor lives in the eastern parts Evidence of spatial clustering Spatial trends Poverty trends Regional poverty
Rural poor tends to live in clusters Water and land factor in livelihood and food security IGB is the hot bed of poor in South Asia Spatial trends Poverty trends Districts
Water poverty of exists when: household is poor or incidence of poverty is high agriculture play a major role in the rural livelihoods access to a reliable water supply is a key factor in improving productivity Water poverty nexus-analytical framework
Contribution of agriculture Poverty trends 1% of growth in agriculture GDP reduces poverty by 1.05%
How to unravel water land poverty nexus? • Use a Logit Regression model • LR estimate probability of a person being in poverty • P is the logistic cumulative probability function • P/(1-P) is the odds ratio of household being poverty • Combine household and survey data
Data • Household consumption and expenditure survey data • NSSO 55th (1999/00) and 61st (2004/05) rounds • each has 30,000+ households in the IGB • District level aggregates of census data • Population census, agriculture census, annual agriculture at a glance publications, IWMI water and climate atlas • 280 districts in the IGB
Household level Cropped area per person Irrigated area- % of cropped area Land tenure and holding size Socio-economic HH SIZE Sex, religion, social class, education, dwelling type, Access to electricity Type of ration card 14 indicators District level Average grain yields, Fruits and vegetable area Rainfall Gross irrigated area – %GCA % Groundwater irri. area Irrigated water productivity Marginal and small land holdings Road density Access to electricity 13 indicators Data
Results: Agriculture for rural livelihoods Low poverty in agriculture operators • Agriculture is an important component of the livelihoods
Results: Water for agriculture • Yes. Access to water is important • GW irrigation impacts are higher • Water productivity in irrigation can have significant impacts
Results: Water for agriculture • Water productivity in irrigation can have significant impacts • Supplemental irrigation • Reducing the gap of irrigation • Deficit irrigation Yield Consumptive water use
Results: Land for agriculture • Marginal/small lands are significant constraints for reducing poverty • Eastern IGB is besieged with marginal land holdings
Results: Infrastructure & Socio-economic variables • Other statistically significant explanatory variables • Road density, access to electricity • Household head • female headed HH (10% of the households) has high odds poverty • Education of the HH head • 55% has less than primary education • Number of graduate/postgraduate • Social groups • ST,SC (26% of the population) has significantly higher odds • Religions • Muslims (15% of the population) has high odds • Household size • >=5 has sig. higher odds than <=3 • HH with ration cards • BPL (22% of the population) has higher odds
Conclusions • Does water poverty exist? • Very much! • Can agriculture growth have further impact? • Yes. Increase yields! • Increase rainfed yields, intensify irrigated agriculture. • Can water related interventions reduce poverty? • Substantially in the eastern IGB! • Irrigation matters, and reliability of irrigation is even more significant • Increase irrigated water productivity! • Can access to electricity reduce poverty? • Yes. Odds of poverty of those who do not have access to electricity is 2 to 1 • Increase access to electricity in the eastern IGB can result in better water use
Conclusions • Land related interventions help • Large number of marginal and small sizes are the biggest constraint. • Land consolidation, where ever is possible, can contribute to productivity increase and poverty reduction. • Roads, electricity, education matters. • Non-farm employment have a significant impact. • Backward social classes and women headed households have higher poverty. Need thorough analysis of these groups. • Impacts of environmental factors needs to be included Thank you