Download
1 / 36
370 likes | 472 Views
Communicating Financial Data. Athens GA November 2008. Situation. Financial issues need to be communicated Multitude of data sources available Financial (Form 7, Form 11, KRTA) Operational (CWP) Statistical (Census, Surveys) Many levels of detail (Summary & Detail level). Complication.

E N D
Communicating Financial Data Athens GA November 2008
Situation • Financial issues need to be communicated • Multitude of data sources available • Financial (Form 7, Form 11, KRTA) • Operational (CWP) • Statistical (Census, Surveys) • Many levels of detail (Summary & Detail level)
Complication • Difficult to use ratios when communicating • Selecting the right ratio • Correctly interpreting its meaning • Audience has various levels of financial experience
Key Question • What is the best way to use ratios when communicating?
Answer • Show a trend • Compare with peers • Graph the data
Advantages of KRTA • Well known and accepted • Large participation: 820+ co-ops • Consistent reporting format – Form 7 • Calculated identically for all co-ops • Able to compare: • By groups (state, size, growth rate, etc.) • Over time
Use KRTA Intelligently • Differences among co-ops • Accounting • System • KRTA value of 1.55 • “Good” to some • “Bad” to others • Difficult to summarize co-op performance when • Some ratios look “good” • Some ratios look “bad”
It Helps to be skillful with PowerPoint Survey: When using PowerPoint, I am: Flawless (Master of the universe) Good enough (Don’t need PowerPoint for Dummies any longer) Clueless (Still can’t get the “12:00” to stop blinking on my VCR)
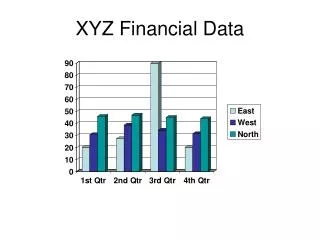
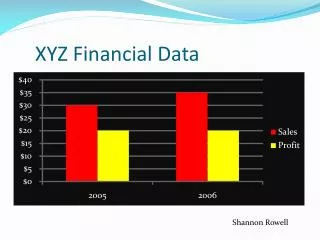
Chart Design: Keep it Simple • Problems encountered with charts/graphs • Too busy looking • Misleading • Solution: (K.I.S.S.) • Avoid special effects • Take time formatting (remove “chart junk”)
Principles of Graphical Excellence Well-designed presentation of interesting data Substance, statistics and design Complex ideas communicated with Clarity, precision & efficiency Greatest number of ideas in the shortest time Least ink in the smallest space Multivariate Telling the truth Source: Edward Tufte, “The Visual Display of Quantitative Information, p51
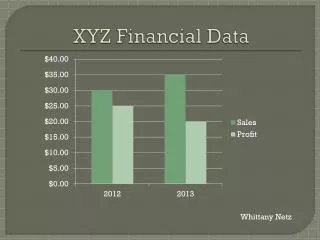
Situation • Declining Margins • Although positive, total margins are declining and are now below the state median • Increasing Expenses • Total cost of service per kWh sold is increasing • Although increasing, it is still below the median • Constant Revenues • Total revenue per kWh sold is remaining level • Median revenue is increasing each year
Complication • Eroding financial performance • Declining MDSC, Best 2/3 • KRTA 11, Modified Debt Service Coverage (MDSC) • Average of the Best 2 out of 3 years • Declining Equity levels • KRTA 16, Equity as a Percent of Assets • Extra discount if equity > 40% • Potential violation of loan covenants • MDSC 1.35 or better
Proposal • Two Rate Increases • 4.5% this year (2008) • 1.5% in three years (2011) • Benefits • Increase MDSC & equity levels • New rate still below US median • New rate equal to state median • No change to capital credit retirement policy
Rate Increase Summary • Two rate increases • 4.5% this year (2008) • 1.5% in three years (2011) • Benefits • Increase MDSC & equity levels • New rate competitive with US & state median • No change to capital credit retirement policy
Getting KRTA Data • Go to CFC web site (www.nrucfc.coop) • Login to Extranet (Username & Password) • Click on: Portfolio KRTA Reports Standard KRTA • Download Excel Spreadsheet • Open or save KRTA report
Copy KRTA Report Right click on upper left corner and select “Copy”
Good Information Sources http://www.perceptualedge.com/examples.php