Download
1 / 13
130 likes | 230 Views
Subsurface Convective Flows within Active Regions. Bradley W. Hindman Deborah A. Haber Juri Toomre JILA/University of Colorado. Ring Power Spectra. f mode. p 1 mode. p 2 mode. p 3 mode. The modes appear as nested trumpets aligned with the frequency axis.

E N D
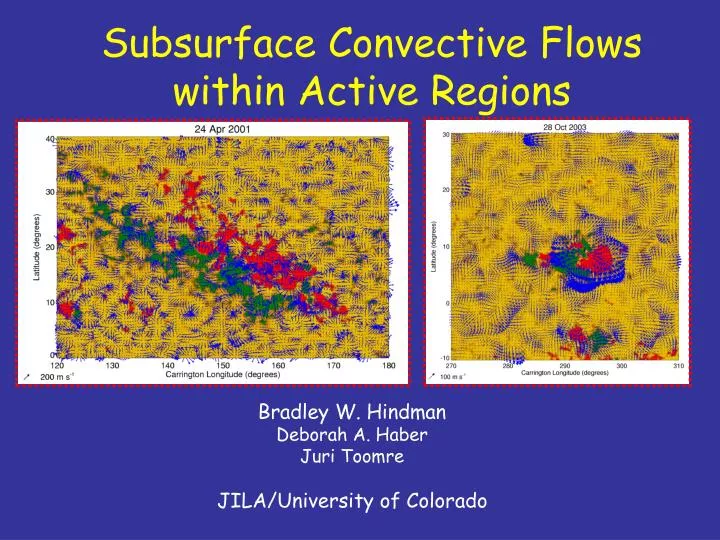
Subsurface Convective Flows within Active Regions Bradley W. Hindman Deborah A. Haber Juri Toomre JILA/University of Colorado
Ring Power Spectra f mode p1 mode p2 mode p3 mode The modes appear as nested trumpets aligned with the frequency axis. Cuts at constant frequency produce nested rings that have larger radii for larger frequencies. Changes in the mode frequencies manifest as changes to the radii of the rings. Therefore, careful measurement of the radii can be used to determine subsurface structure (sound speed, gas pressure, etc.).
The Effects on p-mode Spectra Tracked Not Tracked The above spectra was obtained by studying the same area on the solar disk. Equatorial rotation results in a speed of ~ 2000 m/s. This above spectra was obtained by following the same patch of fluid as it rotates across the solar disk. This removes the large rotational velocity.
Low-Resolution Mapping Inflow nearthe surface Outflow at depth
Contours of the Smoothed Magnetogram 50 G 100 G 150 G 200 G 250 G
Inflows Inflow NOAO 9433 Outflow Inflow Average of all active regions March 29 – April 24, 2002 [03/29 – 05/21] Outflow
Divergence and Curl Average of all active regions March 29 – April 24, 2002 [ 03/29 – 05/21]. ◊ 50 G contour ◊ 100 G contour ◊ 150 G contour ◊ 200 G contour
Conclusions • The boundaries of active regions are zones of inflow, with typical inflow speeds of 20 m/s. • The cores of active regions generally possess strong outflows (50 m/s), probably the result of outflows from sunspots. • We see no evidence for systematic vertical vorticity within active regions. (At least at the spatial scale sampled by out HRRA technique.)