Download
1 / 1
10 likes | 134 Views
Use of molecular mapping techniques for adaptation to low rainfall levels in Pacific Northwest wheat Surya L. Shrestha 1 , Scot H. Hulbert 1 , Kimberly Garland-Campbell 2 and Arron H. Carter 1 1 Department of Crop and Soil Science, Washington State University, Pullman, WA

E N D
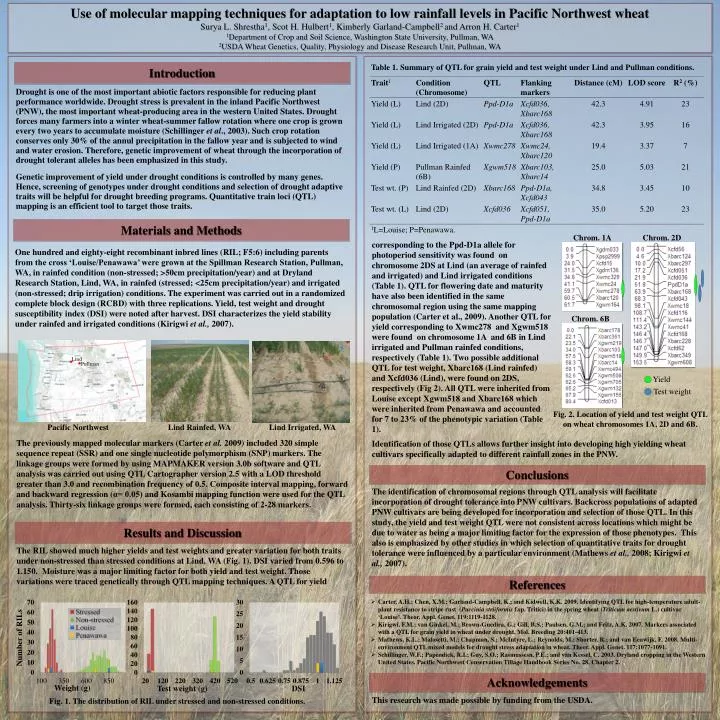
Use of molecular mapping techniques for adaptation to low rainfall levels in Pacific Northwest wheat Surya L. Shrestha1, Scot H. Hulbert1, Kimberly Garland-Campbell2 and Arron H. Carter1 1Department of Crop and Soil Science, Washington State University, Pullman, WA 2USDA Wheat Genetics, Quality, Physiology and Disease Research Unit, Pullman, WA Table 1. Summary of QTL for grain yield and test weight under Lind and Pullman conditions. Introduction Drought is one of the most important abiotic factors responsible for reducing plant performance worldwide. Drought stress is prevalent in the inland Pacific Northwest (PNW), the most important wheat-producing area in the western United States. Drought forces many farmers into a winter wheat-summer fallow rotation where one crop is grown every two years to accumulate moisture (Schillinger et al., 2003). Such crop rotation conserves only 30% of the annul precipitation in the fallow year and is subjected to wind and water erosion. Therefore, genetic improvement of wheat through the incorporation of drought tolerant alleles has been emphasized in this study. Genetic improvement of yield under drought conditions is controlled by many genes. Hence, screening of genotypes under drought conditions and selection of drought adaptive traits will be helpful for drought breeding programs. Quantitative train loci (QTL) mapping is an efficient tool to target those traits. Materials and Methods 1L=Louise; P=Penawawa. Chrom. 1A Chrom. 2D corresponding to the Ppd-D1a allele for photoperiod sensitivity was found on chromosome 2DS at Lind (an average of rainfed and irrigated) and Lind irrigated conditions (Table 1). QTL for flowering date and maturity have also been identified in the same chromosomal region using the same mapping population (Carter et al., 2009). Another QTL for yield corresponding to Xwmc278 and Xgwm518 were found on chromosome 1A and 6B in Lind irrigated and Pullman rainfed conditions, respectively (Table 1). Two possible additional QTL for test weight, Xbarc168 (Lind rainfed) and Xcfd036 (Lind), were found on 2DS, respectively (Fig 2). All QTL were inherited from Louise except Xgwm518 and Xbarc168 which were inherited from Penawawa and accounted for 7 to 23% of the phenotypic variation (Table 1). One hundred and eighty-eight recombinant inbred lines (RIL; F5:6) including parents from the cross ‘Louise/Penawawa’ were grown at the Spillman Research Station, Pullman, WA, in rainfed condition (non-stressed; >50cm precipitation/year) and at Dryland Research Station, Lind, WA, in rainfed (stressed; <25cm precipitation/year) and irrigated (non-stressed; drip irrigation) conditions. The experiment was carried out in a randomized complete block design (RCBD) with three replications. Yield, test weight and drought susceptibility index (DSI) were noted after harvest. DSI characterizes the yield stability under rainfed and irrigated conditions (Kirigwi et al., 2007). Chrom. 6B Yield Lind Test weight Pullman Fig. 2. Location of yield and test weight QTL on wheat chromosomes 1A, 2D and 6B. Pacific Northwest Lind Rainfed, WA Lind Irrigated, WA The previously mapped molecular markers (Carter et al. 2009) included 320 simple sequence repeat (SSR) and one single nucleotide polymorphism (SNP) markers. The linkage groups were formed by using MAPMAKER version 3.0b software and QTL analysis was carried out using QTL Cartographer version 2.5 with a LOD threshold greater than 3.0 and recombination frequency of 0.5. Composite interval mapping, forward and backward regression (α= 0.05) and Kosambi mapping function were used for the QTL analysis. Thirty-six linkage groups were formed, each consisting of 2-28 markers. Identification of those QTLs allows further insight into developing high yielding wheat cultivars specifically adapted to different rainfall zones in the PNW. Conclusions The identification of chromosomal regions through QTL analysis will facilitate incorporation of drought tolerance into PNW cultivars. Backcross populations of adapted PNW cultivars are being developed for incorporation and selection of those QTL. In this study, the yield and test weight QTL were not consistent across locations which might be due to water as being a major limiting factor for the expression of those phenotypes. This also is emphasized by other studies in which selection of quantitative traits for drought tolerance were influenced by a particular environment (Mathews et al., 2008; Kirigwi et al., 2007). Results and Discussion The RIL showed much higher yields and test weights and greater variation for both traits under non-stressed than stressed conditions at Lind, WA (Fig. 1). DSI varied from 0.596 to 1.150. Moisture was a major limiting factor for both yield and test weight. Those variations were traced genetically through QTL mapping techniques. A QTL for yield References • Carter, A.H.; Chen, X.M.; Garland-Campbell, K.; and Kidwell, K.K. 2009. Identifying QTL for high-temperature adult-plant resistance to stripe rust (Puccinia striiformis f.sp. Tritici) in the spring wheat (Triticum aestivum L.) cultivar ‘Louise’. Theor. Appl. Genet. 119:1119-1128. • Kirigwi, F.M.; van Ginkel, M.; Brown-Guedira, G.; Gill, B.S.; Paulsen, G.M.; and Fritz, A.K. 2007. Markers associated with a QTL for grain yield in wheat under drought. Mol. Breeding 20:401-413. • Mathews, K.L.; Malosetti, M.; Chapman, S.; McIntyre, L.; Reynolds, M.; Shorter, R.; and van Eeuwijk, F. 2008. Multi-environment QTL mixed models for drought stress adaptation in wheat. Theor. Appl. Genet. 117:1077-1091. • Schillinger, W.F.; Papendick, R.I.; Guy, S.O.; Rasmussesn, P.E.; and van Kessel, C. 2003. Dryland cropping in the Western United States. Pacific Northwest Conservation Tillage Handbook Series No. 28, Chapter 2. Number of RILs Acknowledgements Weight (g) Test weight (g) DSI This research was made possible by funding from the USDA. Fig. 1. The distribution of RIL under stressed and non-stressed conditions.