Download
1 / 21
210 likes | 312 Views
Bay breeze enhanced air pollution event in Houston, Texas during the DISCOVER-AQ field campaign. Christopher P. Loughner (University of Maryland) Melanie Follette-Cook (Morgan State University) Kenneth E. Pickering (NASA Goddard Space Flight Center)

E N D
Bay breeze enhanced air pollution event in Houston, Texas during the DISCOVER-AQ field campaign Christopher P. Loughner (University of Maryland) Melanie Follette-Cook (Morgan State University) Kenneth E. Pickering (NASA Goddard Space Flight Center) Mark Estes (Texas Commission on Environmental Quality) Funded by: NASA DISCOVER-AQ and Texas AQRP
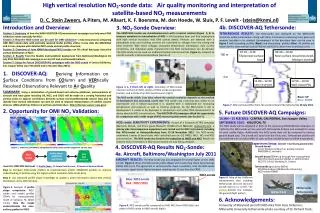
Introduction • Event: High air pollution event occurred September 25-26, 2013 in Houston, TX during the DISCOVER-AQ campaign. Northerly transport and sea and bay breezes were in place during this event. • Science Question: What were the roles of regional vs. local emissions, regional transport, and sea and bay breezes on this air pollution event?
DISCOVER-AQ (Deriving Information on Surface conditions from Column and VERtically resolved observations relevant to Air Quality) • Houston deployment: September 2013 • 9 flight days conducting spirals and missed approaches throughout the Houston metropolitan area. • Numerous other ground-based measurements (Pandora UV/Vis spectrometers, AERONET sunphotometers, in-situ stationary and mobile platforms, ozonesondes, and tethersondes).
Maximum 8 hour average ozone during September 2013 • Houston deployment: September 2013 • Onshore flow during most of the campaign • September 25 was the exception • Northerly transport into Houston • Sea and bay breezes caused pollutants to recirculate
Maximum 8 hour average ozone during September 20-30, 2013 • September 25: 6 of the 15 sites shown violated EPA’s maximum 8 hour average ozone standard • September 26: 2 of the 15 sites shows violated EPA’s maximum 8 hour average ozone standard
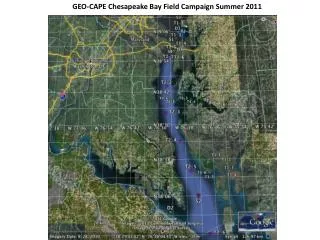
Air Monitoring Sites in Houston Region Conroe 101 85 Sept. 26: peak ozone NW of Houston Jones Forest 94 90 Sept. 25: peak ozone near western shore of Galveston Bay 1-hr 8-hr Max (ppbv) La Porte 151 124 Seabrook 132 104 Texas 119 89 City
HYSPLIT Backtrajectories from NAM model output initialized at 2000 UTC over LaPorte Sylvan Beach September 25: North-northwesterly wind transport into Houston September 26: Continental air transported over the Gulf of Mexico and then back inland over Houston
WRF-CMAQ Simulations • Time period: 28 August – 2 October, 2013 • Re-initialize WRF every 3 days • Length of each WRF run: 3.5 days (first 12 hours of each run is discarded) • Initial and Boundary Conditions: North American Regional Reanalysis and MOZART Chemical Transport Model • CMAQ run offline 36 km 12 km 4 km
September 24 Northerly winds present day prior to air pollution episode.
September 24 Northerly winds present day prior to air pollution episode. Maximum 8 hour average ozone CMAQ simulates high ozone offshore associated with northerly transport.
September 25 back trajectories from 4 km WRF output initialized at 2 pm CST over La Porte Sylvan Beach at 0.5 km AGL (red), 1.0 km AGL (green), and 2.0 km AGL (blue); D=DallasTrajectories pass over Dallas
September 25 6 am CST: Observations – calm winds Model – northwesterly transport into Houston
September 25 6 am CST: Observations – calm winds Model – northwesterly transport into Houston 2 pm CST: Bay and sea breeze form. Model simulates weaker bay and sea breezes.
September 25 3 pm CST: Observations reveal the bay breeze front located near the middle of Houston, while CMAQ shows it to the south.
September 25 3 pm CST: Observations reveal the bay breeze front located near the middle of Houston, while CMAQ shows it to the south. Maximum 8 hour average ozone Obs: peak ozone over Galveston and Galveston Bay. CMAQ: peak ozone over Galveston
P-3B and CMAQ ozone profile over Galveston Observations reveal high ozone around 975mb and low ozone at the surface. Model does not capture the observed profile shape. High model bias at surface due to weaker simulated sea and bay breezes. P-3B (black) CMAQ (red)
September 26 6 am CST: Weak winds, stagnant conditions overnight.
September 26 6 am CST: Weak winds, stagnant conditions overnight. 3 pm CST: Southeasterlies.
September 26 Maximum 8 hour average ozone 6 am CST: Weak winds, stagnant conditions overnight. Southeasterly transport results in peak ozone being located northwest of Houston. 3 pm CST: Southwesterlies.
Conclusions and Future Work • WRF simulated weaker sea and bay breezes than observed, which resulted in low ozone biases inland and a high bias at Galveston. WRF and CMAQ also did not agree with the shape of the ozone profile over Galveston. • Future WRF sensitivity tests will be performed to try to improve the bay and sea breeze model representation (increase model resolution to 1 km; nudging finer domains?). • Investigate the role of local vs regional (Dallas) emissions on this air pollution episode.