Download
1 / 1
20 likes | 121 Views
Introduction and Overview:. 4b . DISCOVER-AQ Tethersonde : . 3. NO 2 -Sonde Overview:. Section 1: Summary of how the NASA DISCOVER-AQ measurement campaigns can help meet OMI validation needs especially for NO2;

E N D
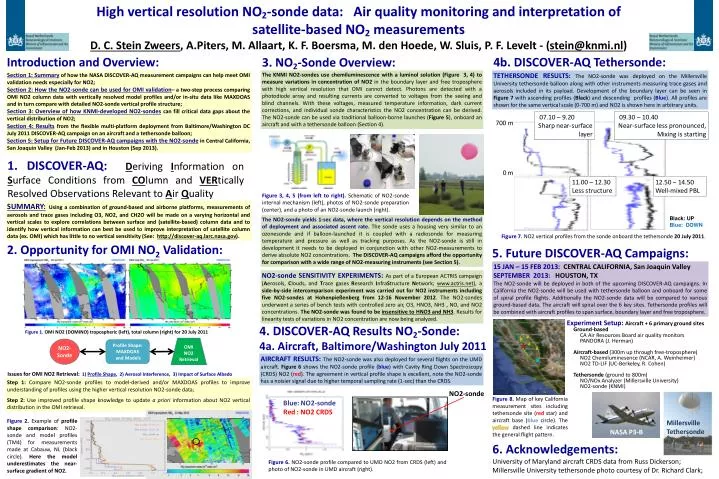
Introduction and Overview: 4b. DISCOVER-AQ Tethersonde: 3. NO2-Sonde Overview: Section 1: Summaryofhow the NASA DISCOVER-AQ measurement campaigns can help meet OMI validation needs especially for NO2; Section 2:How the NO2-sonde can be used for OMI validation–a two-step process comparing OMI NO2 column data with vertically resolved model profiles and/or in-situ data like MAXDOAS and in turn compare with detailed NO2-sonde vertical profile structure; Section 3: Overview of how KNMI-developed NO2-sondescan fill critical data gaps about the vertical distribution of NO2; Section 4: Resultsfrom the flexible multi-platform deployment from Baltimore/Washington DC July 2011 DISCOVER-AQ campaign on an aircraft and a tethersonde balloon; Section 5: Setup for Future DISCOVER-AQ campaigns with the NO2-sondein Central California, San Joaquin Valley (Jan-Feb 2013) and in Houston (Sep 2013). The KNMI NO2-sondes use chemiluminescence with a luminol solution (Figure 3, 4) to measure variations in concentration of NO2 in the boundary layer and free troposphere with high vertical resolution that OMI cannot detect. Photons are detected with a photodiode array and resulting currents are converted to voltages from the seeing and blindchannels. With these voltages, measured temperature information, dark current corrections, and individual sonde characteristics the NO2 concentration can be derived. The NO2-sonde can be used via traditional balloon-borne launches (Figure 5), onboard an aircraft and with a tethersondeballoon (Section 4). TETHERSONDE RESULTS: The NO2-sonde was deployed on the Millersville University tethersonde balloon along with other instruments measuring trace gases and aerosols included in its payload. Development of the boundary layer can be seen in Figure 7 with ascending profiles (Black) and descending profiles (Blue). All profiles are shown for the same vertical scale (0-700 m) and NO2 is shown here in arbitrary units. High vertical resolution NO2-sonde data: Air quality monitoring and interpretation of satellite-based NO2measurementsD. C. Stein Zweers, A.Piters, M. Allaart, K. F. Boersma, M. den Hoede, W. Sluis, P. F. Levelt - (stein@knmi.nl) 1. DISCOVER-AQ: Deriving Information on Surface Conditions from COlumn and VERtically Resolved Observations Relevant to Air Quality OMI NO2 Retrieval NO2- Sonde Profile Shape: MAXDOAS and Models Figure 3, 4, 5 (from left to right).Schematic of NO2-sonde internal mechanism (left), photos of NO2-sonde preparation (center), and a photo of an NO2-sonde launch (right). SUMMARY:Using a combination of ground-based and airborne platforms, measurements of aerosols and trace gases including O3, NO2, and CH2O will be made on a varying horizontal and vertical scales to explore correlations between surface and (satellite-based) column data and to identify how vertical information can best be used to improve interpretation of satellite column data (ex. OMI) which has little to no vertical sensitivity (See: http://discover-aq.larc.nasa.gov). The NO2-sonde yields 1-sec data, where the vertical resolution depends on the method of deployment and associated ascent rate.The sonde uses a housing very similar to an ozonesondeand if balloon-launched it is coupled with a radiosondefor measuring temperature and pressure as well as tracking purposes. As the NO2-sonde is still in development it needs to be deployed in conjunction with other NO2-measurements to derive absolute NO2 concentrations. The DISCOVER-AQ campaigns afford the opportunity for comparison with a wide range of NO2-measuring instruments (see Section 5). Figure 7.NO2vertical profiles from the sonde onboard the tethersonde20 July 2011. 2. Opportunity for OMI NO2 Validation: 5. Future DISCOVER-AQ Campaigns: 15 JAN – 15 FEB 2013: CENTRAL CALIFORNIA, San Joaquin Valley SEPTEMBER 2013: HOUSTON, TX The NO2-sonde will be deployed in both of the upcoming DISCOVER-AQ campaigns. In California the NO2-sonde will be used with tethersondeballoon and onboard for some of spiral profile flights. Additionally the NO2-sonde data will be compared to various ground-based data. The aircraft will spiral over the 6 key sites. Tethersonde profiles will be combined with aircraft profiles to span surface, boundary layer and free troposphere. NO2-sonde SENSITIVITY EXPERIMENTS: As part of a European ACTRIS campaign (Aerosols, Clouds, and Trace gases Research InfraStructureNetwork; www.actris.net), a side-by-side intercomparisonexperiment was carried out for NO2 instruments includingfive NO2-sondes at Hohenpießenberg from 12-16 November 2012. The NO2-sondes underwent a series of bench tests with controlled zero air, O3, HNO3, NH3 , NO, and NO2 concentrations. The NO2-sonde was found to be insensitive to HNO3 and NH3. Results for linearity tests of variations in NO2 concentration are now being analyzed. Experiment Setup: Aircraft + 6 primary ground sites Ground-based CA Air Resources Board air quality monitors PANDORA (J. Herman) Aircraft-based(300m up through free-troposphere) NO2 Chemiluminesence(NCAR, A. Weinheimer) NO2 TD-LIF (UC-Berkeley, R. Cohen) Tethersonde (ground to 800m) NO/NOxAnalyzer (Millersville University) NO2-sonde (KNMI) 4. DISCOVER-AQ Results NO2-Sonde: 4a. Aircraft, Baltimore/Washington July 2011 Figure 1. OMI NO2 (DOMINO) tropospheric (left), total column (right) for 20 July 2011 AIRCRAFT RESULTS: The NO2-sonde was also deployed for several flights on the UMD aircraft. Figure 6 shows the NO2-sonde profile (blue) with Cavity Ring Down Spectroscopy (CRDS) NO2 (red). The agreement in vertical profile shape is excellent, note the NO2-sonde has a noisier signal due to higher temporal sampling rate (1-sec) than the CRDS. Issues for OMI NO2 Retrieval:1) Profile Shape, 2) Aerosol Interference, 3) Impact of Surface Albedo Step 1: Compare NO2-sonde profiles to model-derived and/or MAXDOAS profiles to improve understanding of profiles using the higher vertical resolution NO2-sonde data; Step 2: Use improved profile shape knowledge to update a priori information about NO2 vertical distribution in the OMI retrieval. Figure 8.Map of key California measurement sites including tethersonde site (red star) and aircraft base (blue circle). The yellowdashed line indicates the general flight pattern. Millersville Tethersonde Figure 2.Example of profile shape comparison: NO2-sonde and model profiles (TM4) for measurements made at Cabauw, NL (black circle). Here the model underestimates the near-surface gradient of NO2. NASA P3-B 6. Acknowledgements: University of Maryland aircraft CRDS data from Russ Dickerson; Millersville University tethersonde photo courtesy of Dr. Richard Clark; Figure 6.NO2-sonde profile compared to UMD NO2 from CRDS (left) and photo of NO2-sonde in UMD aircraft (right).