Download
1 / 21
230 likes | 383 Views
The Classification of Stellar Spectra.

E N D
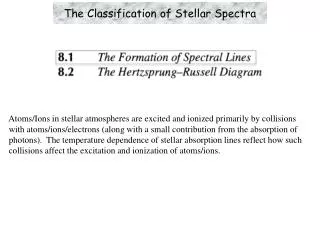
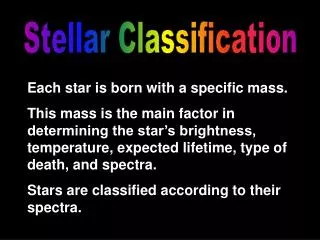
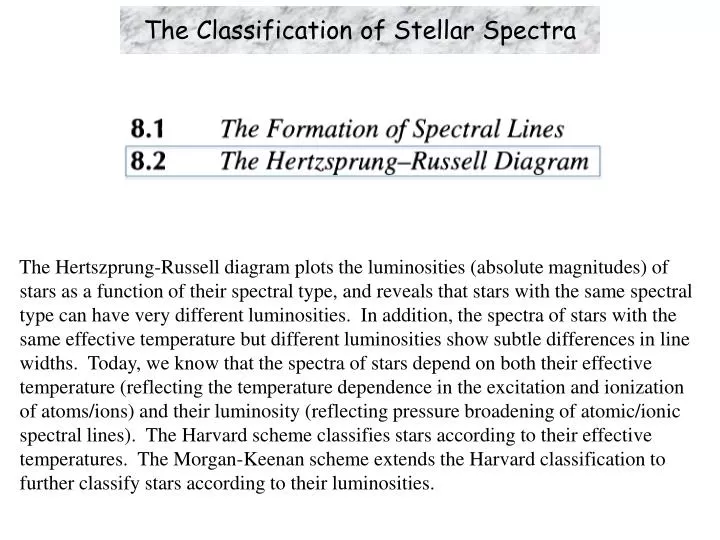
The Classification of Stellar Spectra The Hertszprung-Russell diagram plots the luminosities (absolute magnitudes) of stars as a function of their spectral type, and reveals that stars with the same spectral type can have very different luminosities. In addition, the spectra of stars with the same effective temperature but different luminosities show subtle differences in line widths. Today, we know that the spectra of stars depend on both their effective temperature (reflecting the temperature dependence in the excitation and ionization of atoms/ions) and their luminosity (reflecting pressure broadening of atomic/ionic spectral lines). The Harvard scheme classifies stars according to their effective temperatures. The Morgan-Keenan scheme extends the Harvard classification to further classify stars according to their luminosities.
Learning Objectives • Stellar EvolutionEarly and Late Spectral Type Stars Stellar Luminosities and Sizes • Hertzprung-Russel Diagram • Morgan-Keenan Classification Luminosity classes Pressure broadening of spectral lines • Spectroscopic Parallax
Learning Objectives • Stellar EvolutionEarly and Late Spectral Type Stars Stellar Luminosities and Sizes • Hertzprung-Russel Diagram • Morgan-Keenan Classification Luminosity classes Pressure broadening of spectral lines • Spectroscopic Parallax
Stellar Evolution • By the early 20th century, astronomers had some notion of the - luminosities of stars (distances measured through trigonometric parallaxes) - masses of stars (from studies of binary systems) - effective temperatures of stars (from studies of stellar spectral lines) • At the time, astronomers believed that stars began their lives as hot and luminous O stars and ended their lives as cool and dim M stars. (Today, we know this idea to be incorrect.) • Astronomers therefore referred to stars with spectral types O, B, and A as early spectral types (under the notion that these stars were relatively young) and F, G, K, and M as late spectral types (under the notion that these stars were relatively old). This tradition remains in the language of astronomers. } Age ➙ { Oh Be AFine Girl/Guy Kiss Me Early-type stars Late-type stars
Stellar Luminosities and Sizes • If the idea of stellar cooling was correct, there should therefore be a relation between a star’s luminosity (absolute magnitude) and its spectral type. • In 1905, A Danish engineer and amateur astronomer, EjnarHertzsprung, compared the absolute magnitudes and spectral types of stars for which both quantities had been accurately determined. • Independently, an astronomer at Princeton University, Henry Norris Russell, was conducting a similar study. EjnarHertzsprung, 1873-1965 Henry Norris Russell, 1877-1957
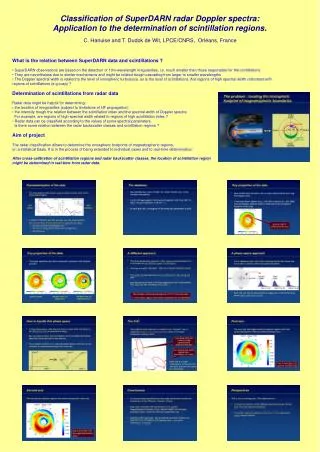
Stellar Luminosities and Sizes • Russell published the following plot based on more than 200 stars. Later Spectral Type • Does this plot support the argument that earlier spectral types are more luminous than later spectral types? Luminosity
Stellar Luminosities and Sizes • Russell published the following plot based on more than 200 stars. Later Spectral Type • Does this plot support the argument that earlier spectral types are more luminous than later spectral types? To a degree yes, in the sense that there seems to be a trend of higher luminosity towards earlier spectral types. Luminosity
Stellar Luminosities and Sizes • Russell published the following plot based on more than 200 stars. Later Spectral Type • Does this plot support the argument that earlier spectral types are more luminous than later spectral types? To a degree yes, in the sense that there seems to be a trend of higher luminosity towards earlier spectral types. • Looking at all the points as a whole, does this plot support the argument that earlier spectral types are more luminous than later spectral types? Luminosity
Stellar Luminosities and Sizes • Russell published the following plot based on more than 200 stars. Later Spectral Type • Does this plot support the argument that earlier spectral types are more luminous than later spectral types? To a degree yes, in the sense that there seems to be a trend of higher luminosity towards earlier spectral types. • Looking at all the points as a whole, does this plot support the argument that earlier spectral types are more luminous than later spectral types? No, in the sense that the maximum luminosity does not appear to vary much across spectral types. Luminosity
Stellar Luminosities and Sizes • Hertzsprung was puzzled by the discovery that stars of type G and later had a range of luminosities despite the same spectral types. • Stars of the same spectral types but different luminosities must have different sizes, as dictated by the Stefan-Boltzmann law • Hertzsprung therefore referred to the brighter stars as giants. • Independently, Russell came to the same conclusion. He also called the stars in the upper right corner giants. • He called stars in the strip bounded by the diagonal line, containing most (80%-90%) of the stars studied, dwarfs. Later Spectral Type Giants Dwarfs Luminosity
Learning Objectives • Stellar Evolution Early and Late Spectral Type Stars Stellar Luminosities and Sizes • Hertzprung-Russel Diagram • Morgan-Keenan Classification Luminosity classes Pressure broadening of spectral lines • Spectroscopic Parallax
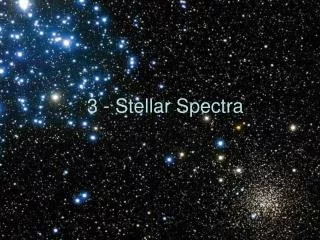
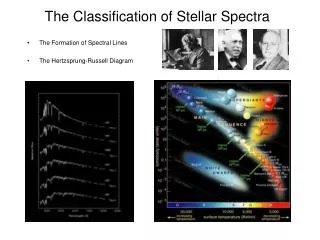
The Hertzsprung-Russel Diagram • A modern version of the Hertzsprung-Russel (H-R) diagram. • This diagram shows a simple relation between a stars’s luminosity and temperature on the main sequence. • A star’s position on the main sequence is governed by a single factor: its mass.
Learning Objectives • Stellar Evolution Early and Late Spectral Type Stars Stellar Luminosities and Sizes • Hertzprung-Russel Diagram • Morgan-Keenan Classification Luminosity classes Pressure broadening of spectral lines • Spectroscopic Parallax
Morgan-Keenan Luminosity Classes • Hertzsprung wondered whether there might be some differences in the spectra of stars of the same spectral type but vastly different luminosities. He found just such a variation in spectra among the stars cataloged by Antonia Maury. • The worked developed by Hertzsprung and Maury, and continued by other astronomers, culminated in the 1943 publication of the Atlas of Stellar Spectra by William W. Morgan and Phillip C. Keenan of the Yerkes Observatory. • Their atlas consists of 55 prints of spectra that clearly display the effect of temperature and luminosity (different stellar radii for a given spectral type) on stellar spectra. • Morgan and Keenan also described their criteria for the classification of each spectrum and extended the Harvard classification by introducing a luminosity class. William W. Morgan, 1906-1994 Phillip C. Keenan, 1908-2000
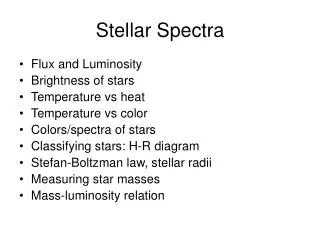
Morgan-Keenan Luminosity Classes • A page from the Atlas of Stellar Spectra.
Morgan-Keenan Luminosity Classes • The spectral lines of stars with the same effective temperature but different luminosities have different widths. • In general, for stars of the same spectral type (effective temperature), narrower lines are produced by stars with higher luminosities.
Spectral Line Profile • Recall the three components that contribute to the profiles of spectral lines: - natural broadening due to Heisenberg’s uncertainty principle (Lorentz profile) - Doppler broadening due to the random motion of hot gas (Gaussian profile) - pressure broadening due to the perturbation of atomic orbitals via collisions with neutral atoms or the electric fields of ions (Lorentz profile)
Pressure Broadening • Larger stars have lower photospheric gas pressures, resulting in weaker pressure broadening and therefore narrower lines.
Learning Objectives • Stellar Evolution Early and Late Spectral Type Stars Stellar Luminosities and Sizes • Hertzprung-Russel Diagram • Morgan-Keenan Classification Luminosity classes Pressure broadening of spectral lines • Spectroscopic Parallax
Spectroscopic Parallax • The M-K classification scheme enables astronomers to locate a star’s position on the Hertzsprung-Russell diagram based entirely on the appearance of its spectrum. • Once the star’s absolute magnitude, M, has been read from the vertical axis of the H-R diagram, the distance to the star can be calculated from its apparent magnitude, m, using Eq. (3.5) • where d is in units of parsecs.
Spectroscopic Parallax • The M-K classification scheme enables astronomers to locate a star’s position on the Hertzsprung-Russell diagram based entirely on the appearance of its spectrum. • Once the star’s absolute magnitude, M, has been read from the vertical axis of the H-R diagram, the distance to the star can be calculated from its apparent magnitude, m, using Eq. (3.5) • where d is in units of parsecs. • This method of determining stellar distances is known as spectroscopic parallax, and is the primary way of determining the distances to stars with no measurable trigonometric parallax. • The intrinsic scatter of roughly ±1 magnitude for a specific luminosity class renders such distance estimates uncertain by a factor of about 101/5 = 1.6.